


 26 148

provided in the Supplementary material, sections 4 (HRQoL) and 5
(costs).
2.6.
Main outcomes and measures
The main outcomes were cost effectiveness of diagnosis, de
fi
ned as the
strategies that detect the most CS cancers for a given pound spent in
testing, and long-term cost effectiveness, de
fi
ned as the strategies that
achieve the most health outcomes given their costs, for alternative cost-
effectiveness thresholds: £13 000 (
s
15 398), £20 000 (
s
23 689), and
£30 000 (
s
35 534)/quality-adjusted life year (QALY) gained
[7,15]. The
results are probabilistic in that they are the average of over 1000 Monte
Carlo simulations. A number of sensitivity analyses were conducted on
the aspects of the short- and long-term components of the model (see
the Supplementary material, section 6, for details).
3.
Results
3.1.
Base-case analysis
3.1.1.
Detection of CS cancers per pound spend in diagnosis
Figure 2A plots the detection of CS cancers and cost of
testing for each of the 383 strategies defined (see the
Supplementary material, section 8, for details, including
costs in euro). Out of all the 383 strategies, the figure
highlights the 14 strategies that are expected to detect the
most CS cancers per pound spent in testing (red circles).
These define a frontier of valuable diagnostic options. The
remaining strategies are not expected to represent a good
value. Owing to the uncertainty around diagnostic accuracy
and costs, some of these retain the possibility of being in the
frontier, that is, of being valuable (black circles).
Four of 14 red strategies detect at least 80% of the CS
cancers: M7 223, T7 223, M7 222, and P4 2 (strategies 10
–
14
in
Fig. 2 A). In M7, all men receive MPMRI and men with a
suspicion of CS cancer receive an MRI-targeted TRUSB. Men
in whom MRI-targeted TRUSB did not detect CS cancer
receive a second MRI-targeted TRUSB. M7 223 detects 85%
(95% confidence interval [CI] 81
–
89%) of CS cancers and
costs £628 (95% CI £597
–
660); M7 222 detects 95% (95%CI
92% to 0.98%) and costs £807 (95%CI £777 to £833). This
MPMRI definition and cut-off refer to MRI-targeted TRUSB
in 96% of men: all men with high-risk CS cancer, 98% with
intermediate-risk CS cancer, 92% with low-risk non-CS
cancer, and 93% with no cancer. T7 consists of testing all
men with TRUSB, followed by MPMRI in men in whom CS
cancer was not detected, and a repeat MRI-targeted TRUSB
in men with negative TRUSB if there is a suspicion of CS
cancer at the MPMRI. T7 223 detects 91% (95% CI 86
–
94%) CS
cancers and costs £709 (95% CI £688
–
730); P4 2 consists of
TRUSB for all men and TPMB for those in whom TRUSB did
not detect CS cancer. It has perfect sensitivity but costs
£1332 (95% CI £1278
–
1385).
3.1.2.
QALYs per NHS spent
Figure 2 Bshows the expected lifetime health outcomes and
costs achieved by each strategy per man referred for testing
[(Fig._1)TD$FIG]
Strategies starƟng with MPMRI
Strategies starƟng with TRUSB
First test
Second test
Third test
MPMRI
NC
Non-CS
CS
MRI-targeted
TRUSB
NC
Non-CS
CS
MRI-targeted
TRUSB
NC
Non-CS
CS
MRI-targeted
TRUSB
NC
Non-CS
CS
MRI-targeted
TRUSB
MRI-targeted
TRUSB
NC
Non-CS
CS
?
?
?
?
?
MRI-targeted
TRUSB
NC
Non-CS
CS
?
NC
Non-CS
CS
First test
Second test
Third test
TRUSB
NC
Non-CS
CS
?
Decision points
M7 strategy
Possible
classificaƟons
MPMRI
NC
Non-CS
CS
MRI-targeted
TRUSB
NC
Non-CS
CS
MRI-targeted
TRUSB
NC
Non-CS
CS
MPMRI
NC
Non-CS
CS
MRI-targeted
TRUSB
NC
Non-CS
CS
MRI-targeted
TRUSB
NC
Non-CS
CS
?
?
?
?
?
?
T7 strategy
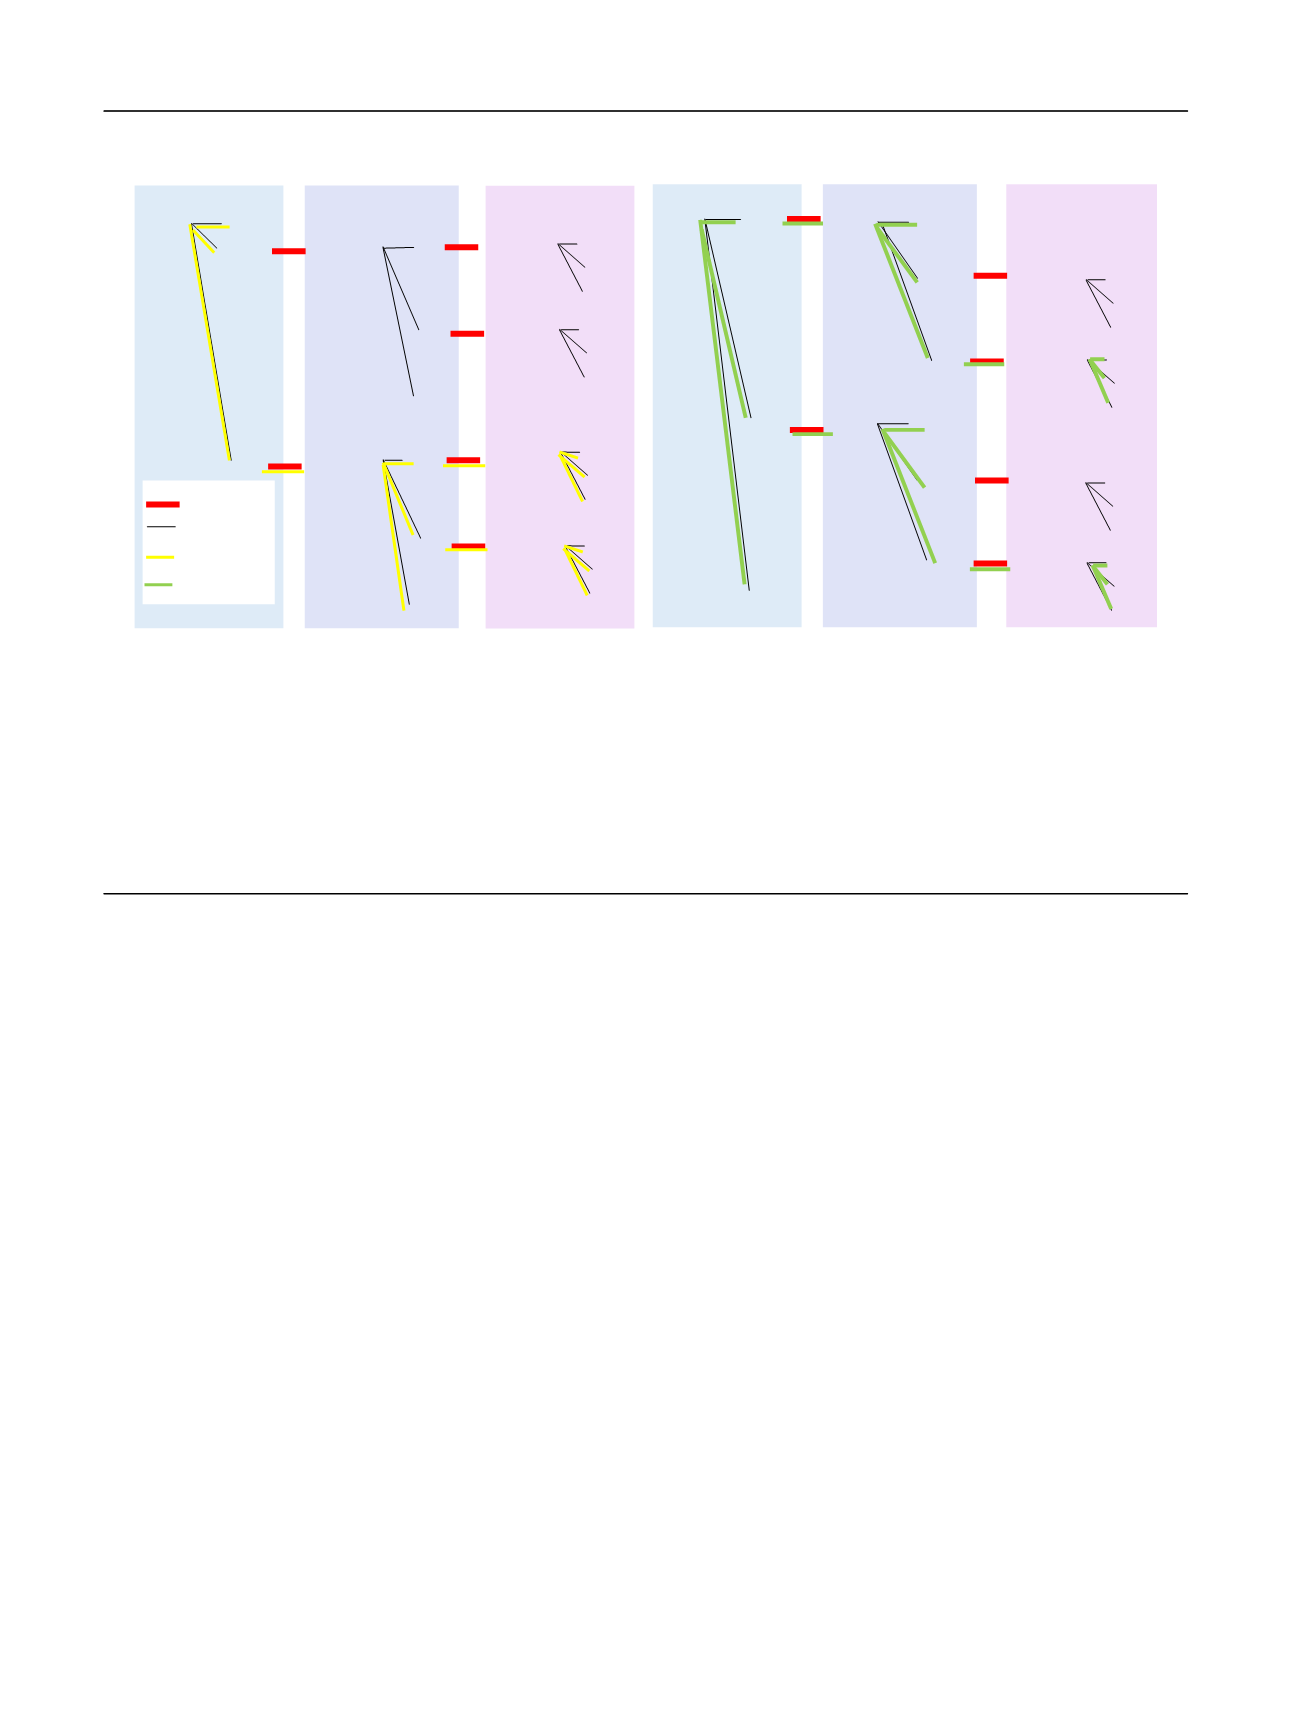
Fig. 1
–
Schematic of decision tree. The diagram represents the decision tree used to predict the outcomes of the diagnostic strategies. The diagram
shows only the general structure of the tree for diagnostic strategies composed of MPMRI and TRUSB; a similar tree was used for strategies including
TPMB. In the model, men can have a sequence of up to three tests. The black lines represent the possible test classifications. The red lines with a
question mark represent decisions. Different decisions constitute different sequences of tests and hence different strategies. The diagram highlights
strategies M7 (left side) and T7 (right side). In M7, men receive MPMRI and are classified as having no suspicion of cancer (no cancer; NC), suspicion of
non-CS cancer, or suspicion of CS cancer. Men with a suspicion of CS cancer receive an MRI-targeted TRUSB, and are classified as having no cancer
(NC), non-CS cancer, and CS cancer. Men in whom CS cancer was not detected, but had a suspicion of CS cancer at the MPMRI, receive a second
MRI-targeted biopsy. In T7, men receive a TRUSB, and are classified as having no cancer (NC), non-CS cancer, and CS cancer. Men in whom CS cancer
was not detected receive an MPMRI, and are classified as having no suspicion of cancer (NC), suspicion of non-CS cancer, or suspicion of CS cancer.
Men classified as having a suspicion of CS cancer based on MPMRI results receive a second TRUSB
—
this time MRI-targeted TRUSB since there is now
information from the MPMRI. CS = clinically significant; MPMRI = multiparametric magnetic resonance imaging; TPMB = template mapping biopsy;
TRUSB = transrectal ultrasound-guided biopsy.
E U R O P E A N U R O L O GY 7 3 ( 2 0 18 ) 2 3
–
3 0
26