


 57 148

arms was detected (adjusted difference:
–
2.6, 95% CI:
–
5.8
to 0.7,
p
= 0.12).
No significant differences were observed on 6-mo
renal unit % split function radionuclear scintigraphy
scans (adjusted difference:
–
1.7, 95% CI:
–
3.8 to 0.4,
p
= 0.11). Overall, 15 (7.5%) grade 3
–
5 complications were
observed in the trial, and no difference was detected
between the study arms (difference: 3.2%, 95% CI:
–
4.1% to
11%,
p
= 0.4). Estimated blood loss and renal ischemia
time were also similar (
p
= 0.2 and
p
= 0.7, respectively;
Table 2.)
We did not find that the effect of mannitol on post-
operative eGFR differed by baseline eGFR (6-mo eGFR
p
= 0.9; 6-wk eGFR,
p
= 1) or by type of surgery (6-mo eGFR
p
= 0.2; 6-wk eGFR,
p
= 0.5).
Post-hoc analysis was completed to determine if there
was interaction between mannitol and clamp time and it
was not significant (
p
= 0.09).
4.
Discussion
The primary aim of this study was to assess the impact on
renal function of intravenous mannitol to determine its
role as an agent that protects against the effects of
transient renal ischemia during NSS. The results of our
study show that mannitol has no clinically measurable
effect on renal function recovery after NSS in patients
with adequate preoperative renal function. Indeed, the
upper bound of the 95% CI for the difference between
study groups excluded the prespecified minimum clini-
cally significant difference. We can thus conclude that
mannitol should not be used in NSS in this clinical
context.
Earlier publications of several well-conducted animal
studies have been used to support the use of mannitol
[1]. Green et al
[9]used acute and chronic models to test the
administration of medications on the recovery of rabbit
kidneys from the effects unilateral normothermic renal
ischemia after 1 h of renal vascular occlusion. Only
propranolol and the diuretics mannitol and furosemide
showed beneficial effect. A follow-up study determined that
0.25 g/kg of mannitol administered 15 min before warm
renal ischemia was beneficial
[10]. The standard dose of
12.5 g of intravenous mannitol administered during NSS
resulted from these studies
[9,10] .Considering higher doses
of mannitol, a prospective randomized trial on 50 recipients
of cadaveric donor renal transplant comparing the admin-
istration of either 50 g of intravenous mannitol or saline
infusion prior to graft revascularization showed a signifi-
cantly decreased incidence of postoperative ATN in the
mannitol group, no impact on the 3-mo eGFR was detected
[11].
To date, the use of intravenous mannitol during NSS has
been part of surgical practice largely due to its legacy effect,
and despite the potential risks. Detrimental renal effects
investigated by Gelman
[6]identified disproportionate
shifts of the renal blood flow received by the renal cortex
(94%) compared with the renal medulla (6%). By selectively
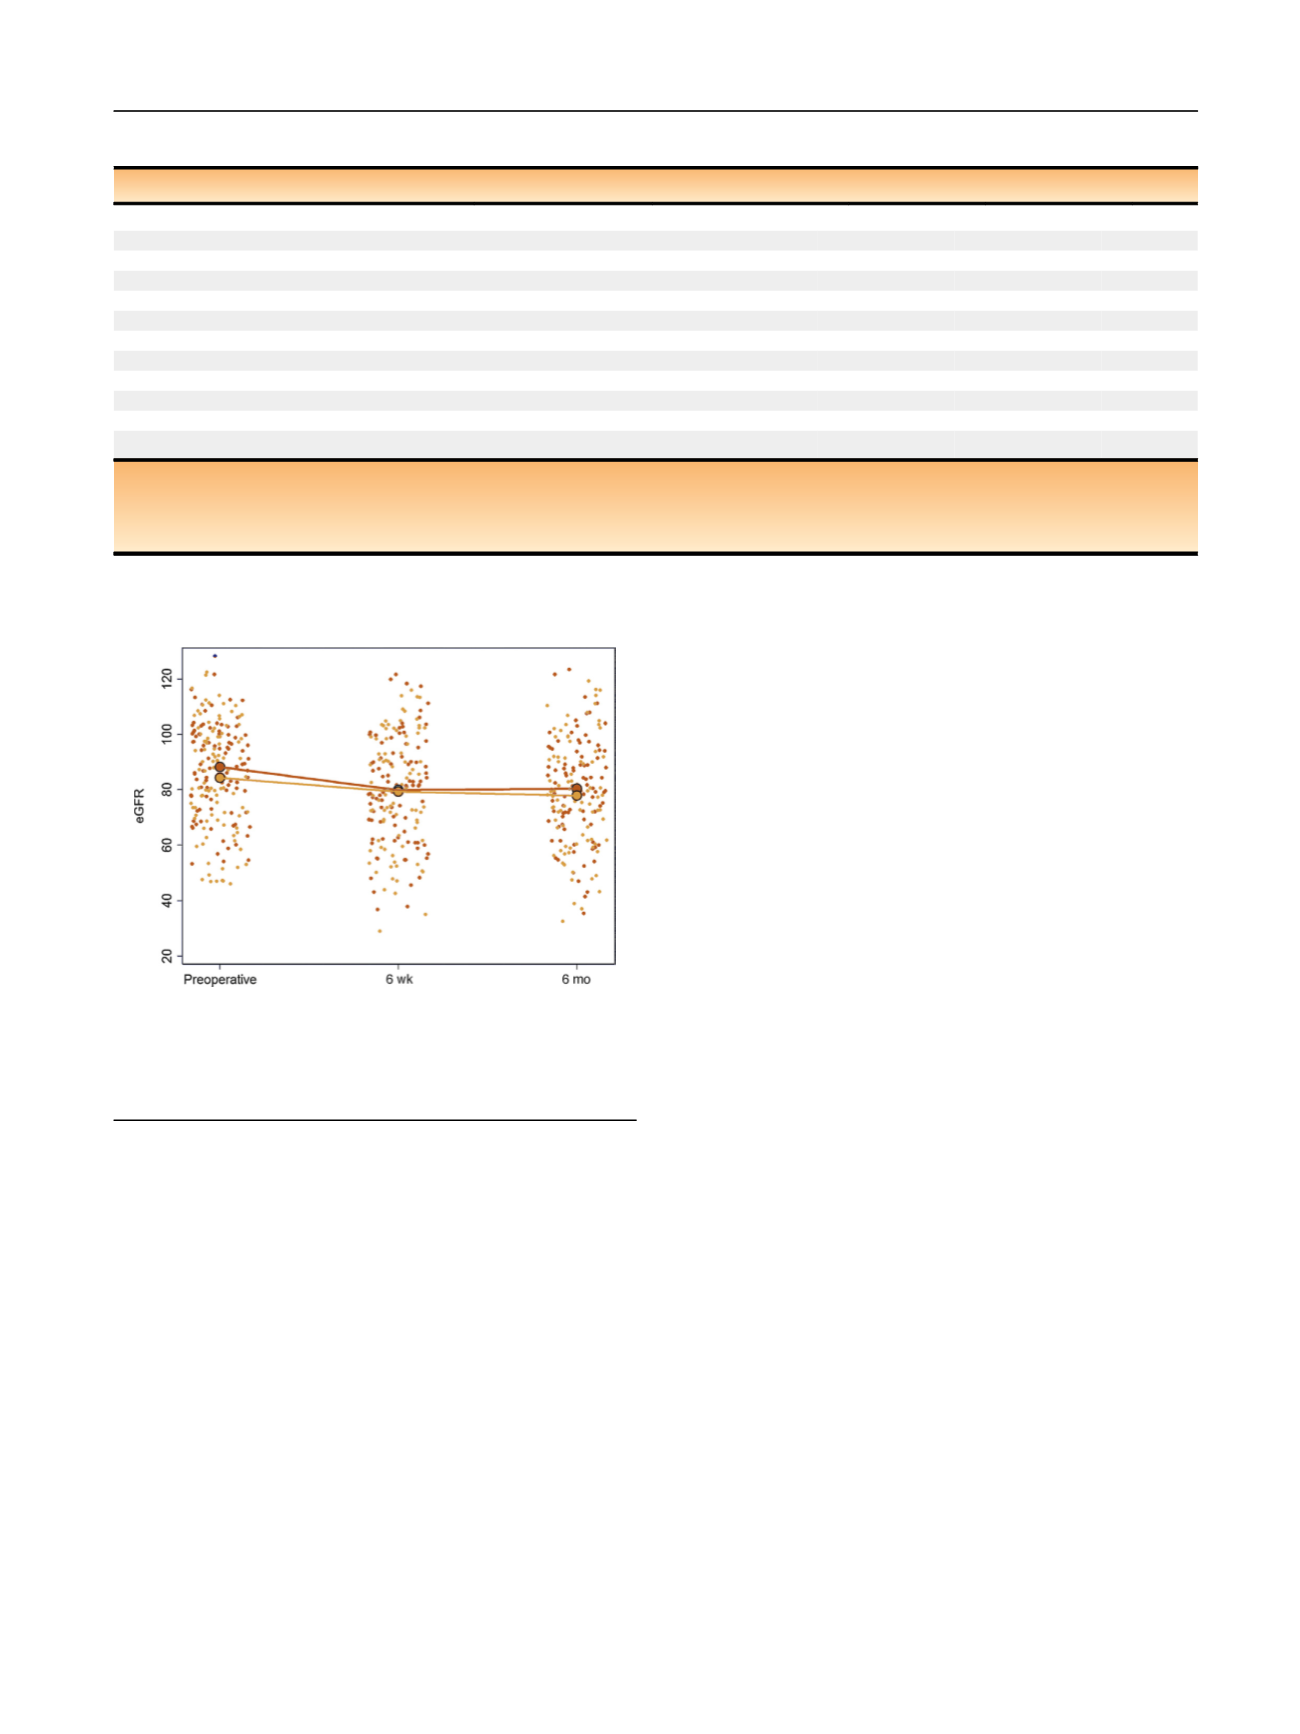
[(Fig._2)TD$FIG]
Fig. 2
–
Estimated glomerular filtration rate (eGFR) over the study
period by treatment group. Small gold dots represent the observed eGFR
in patients enrolled in the mannitol arm; small blue dots represent the
observed eGFR in patients randomized to placebo. Large dots represent
the treatment group means.
Table 2
–
Primary and secondary endpoint outcomes
Placebo (
n
= 98)
Mannitol (
n
= 101)
Difference
95% CI
p
value
6-mo postoperative eGFR (
n
= 178)
0.9
eGFR ml/min/1.73m
2 a80 (18)
78 (20)
0.2
–
3.1 to 3.5
% change from preoperative eGFR
–
8.4 (12)
–
8.5 (14)
0.1
–
3.8 to 4.0
eGFR
<
60 ml/min/1.73m
2
12 (13%)
18 (21%)
–
8%
–
18% to 3.5%
6-wk postoperative eGFR (
n
= 180)
0.12
eGFR ml/min/1.73m
2 a80 (19)
79 (20)
–
2.6
–
5.8 to 0.7
% change from preoperative eGFR
–
9.4 (14)
–
6.2 (13)
–
3.2
–
7.1 to 0.7
eGFR
<
60 ml/min/1.73m
2
13 (14%)
19 (21%)
–
7%
–
18% to 4.1%
6-mo renal scan % split functio
n a ( n = 161)42 (8)
44 (8)
–
1.7
–
3.8 to 0.4
0.11
Grade 3
–
5 complications (
n
= 199)
9 (9.2%)
6 (5.9%)
3.2%
–
4.1% to 11%
0.4
Estimated blood loss (ml)
235 (218)
284 (297)
–
47
–
119, 26
0.2
Clamping time (min)
27 (13)
27 (12)
–
0.7
–
3.9, 2.6
0.7
Statistics presented in the
fi
rst two columns indicate the mean (standard deviation).
CI = con
fi
dence interval; eGFR = estimated glomerular
fi
ltration rate.
a
Individual renal unit where nephron sparing surgery was completed. Difference adjusted for preoperative eGFR and surgical approach. The 6-mo renal scan
model was also adjusted for baseline renal scan (% split function for individual renal units).
E U R O P E A N U R O L O GY 7 3 ( 2 0 18 ) 5 3
–
5 9
57