


 6 148
6 148

[(Fig._1)TD$FIG]
0.01
0.1
1
10
100
0
50
100
150
Concentration (
μ
M)
Growth (% of control)
Darolutamide
Enzalutamide
0.01
0.1
1
10
100
0
100
200
300
400
500
Concentration (
μ
M)
Luciferase activity
(% of control)
Darolutamide
Enzalutamide
DMSO 0.1 1 10
0.1
1 10
0
50
100
150
200
250
Compound concentration (
μ
M)
Relative
PSA
mRNAl evels(%)
Enzalutamide
Darolutamide
A
C
G
Serum PSA
Tumor volume
Antiproliferative effect
PSA
gene expression
Survival proportions
PSA
protein expression
Enzalutamide-resistant MR49F in vivo model
Inhibition of AR transcription
Enzalutamide-resistant
MR49F in vitro model
E
F
–10
0
10
20
30
40
PSA level, foldchange
Vehicle
Darolutamide
Enzalutamide
Change in individual PSA
after 3 wk of treatment
–5
0
5
10
15
20
Tumor volume, fold change
Vehicle
Darolutamide Enzalutamide
Change in individual tumor volume
after 3 wk of treatment
D
B
Darolutamide
Enzalutamide
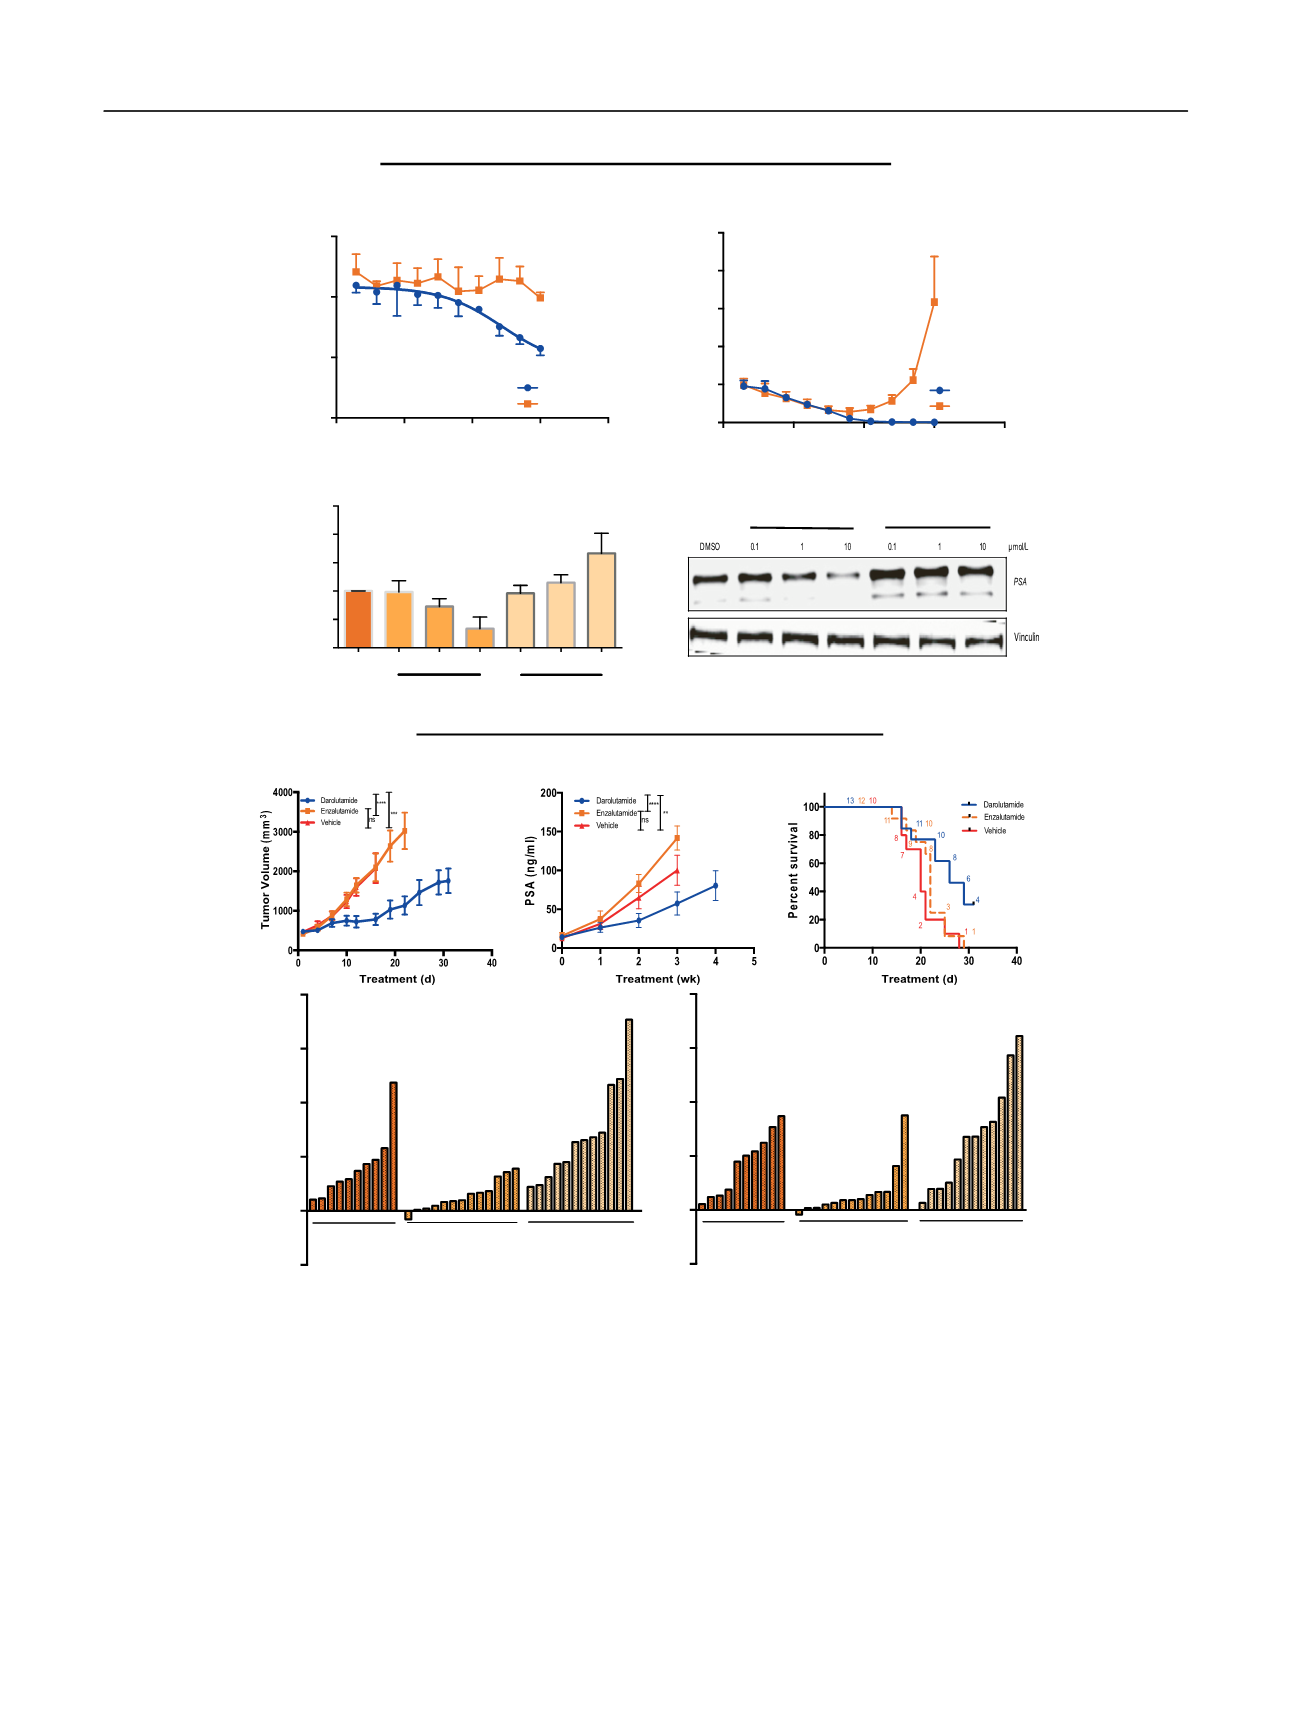
Fig. 1
–
Darolutamide (ODM-201) targeting ENZ (enzalutamide)-resistant prostate cancer in vitro and in vivo. (A) Proliferation of MR49F cells assessed
with MTS assay after 72 h of treatment with darolutamide or ENZ in ENZ-resistant MR49F cells at indicated doses. Pooled means of triplicate
experiments are plotted plus or minus the standard error of the mean. (B) Androgen receptor (AR) transactivation as assessed using luciferase assay
after 24 h of treatment with darolutamide or ENZ in ENZ-resistant MR49F cells at indicated doses. Pooled means of triplicate experiments are plotted
plus or minus the standard error of the mean. (C) Down-regulation of
prostate-specific antigen
(
PSA
) gene expression by darolutamide and up-
regulation by ENZ. MR49F cells were treated with darolutamide or ENZ for 24 h at indicated doses. Total messenger RNA (mRNA) was extracted, reverse
transcribed into complementary DNA and analyzed using real-time polymerase chain reaction. (D) PSA protein levels in MR49F cells following
treatment with darolutamide or ENZ for 48 h at indicated doses. (E) Change in mean tumor volume (left) and serum PSA level (right) in mice bearing
ENZ-resistant MR49F tumors treated with darolutamide 50 mg/kg twice daily versus ENZ 20 mg/kg once daily and versus 50 mg/kg vehicle once daily.
Treatment was started when tumors reached 200 mm
3
. (F) Kaplan-Meier survival curves for mice treated with darolutamide, ENZ, and vehicle. (G)
Waterfall plots showing individual responses for each mouse in tumor volume (left) and serum PSA change from baseline (right) between groups after
3 wk of treatment.
DMSO = dimethyl sulfoxide; ns = not significant.
E U R O P E A N U R O L O GY 7 3 ( 2 0 18 ) 4
–
8
6