


 65 148

patients may help physicians to monitor patients who are
deemed at high risk of recurrence for metastases following
nephrectomy.
The updated OS data were not mature after an additional
10 mo of follow-up, but the results show that OS was not
compromised. With a 40% survival rate at 10 yr after
nephrectomy in patients at high risk (UISS criteria) of
recurrent RCC
[12,13], and given the number of patients and
timeframe required, this study was not powered to show an
improvement in OS. Specifically, a trial designed to
[(Fig._1)TD$FIG]
0.0
0.5
1.0
1.5
2.0
Fuhrman grade 3/4 386 (63)
Fuhrman grade 1/2 227 (37)
UISS: T3 High+T4+any T, N+ 388 (63)
UISS: T4+any T, N+
‡
57 (9)
UISS: T3 High
†
331 (54)
UISS: T3 Low* 227 (37)
NLR ≤3 470 (76)
NLR >3 139 (23)
ECOG PS ≥1 164 (27)
ECOG PS 0 448 (73)
Obese (BMI ≥30) 126 (21)
Overweight + Obese (BMI ≥25) 393 (64)
Overweight (25 ≤BMI <30) 267 (43)
Normal weight (18.5 ≤BMI <25) 204 (33)
Male 451 (73)
Female 164 (27)
Age <45 yr 76 (12)
Age 45-64 yr 381 (62)
Age ≥65 yr 158 (26)
Intent-to-treat patients 615 (100)
HR
Favors Sunitinib
Favors Placebo
n
(%)
HR (95% CI)
P
0.76 (0.60–0.98) 0.03
0.59 (0.36–0.95) 0.03
0.94 (0.69–1.29) 0.71
0.43 (0.20–0.92) 0.02
0.68 (0.41–1.14) 0.14
0.80 (0.60–1.06) 0.11
0.63 (0.41–0.96) 0.03
0.90 (0.63–1.31) 0.59
0.85 (0.62–1.15) 0.29
0.76 (0.42–1.36) 0.35
0.69 (0.51–0.93) 0.01
0.99 (0.63–1.56) 0.96
1.01 (0.58–1.77) 0.96
0.72 (0.54–0.95) 0.02
0.82 (0.53–1.28) 0.38
0.77 (0.55–1.07) 0.11
0.62 (0.31–1.23) 0.17
0.74 (0.55–0.99) 0.04
0.85 (0.54–1.33) 0.47
0.73 (0.55–0.98) 0.04
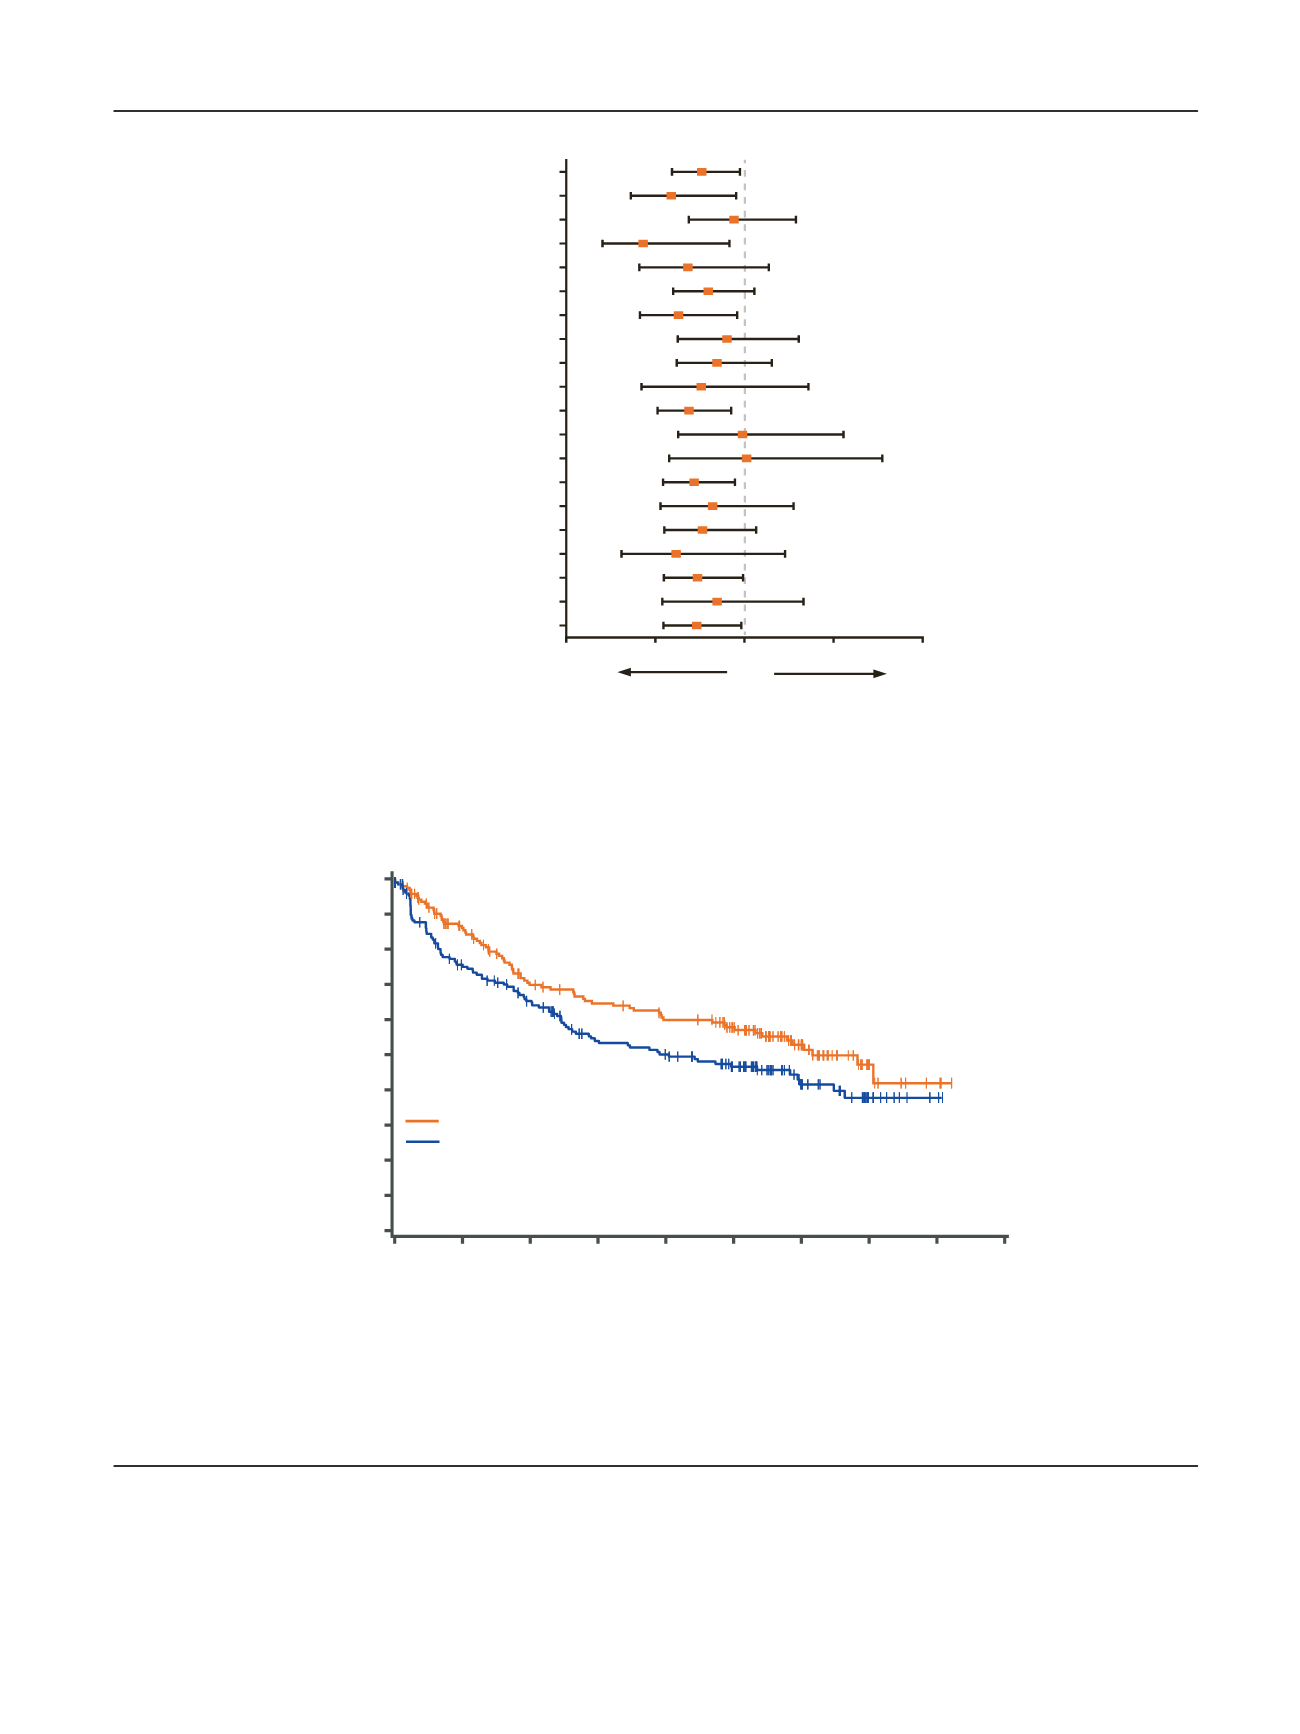
Fig. 1
–
Disease-free survival by subgroup. * T3 tumor, no or undetermined nodal involvement, no metastasis, any Fuhrman grade, ECOG PS 0; or
Fuhrman grade 1, ECOG PS 1.
y
T3 tumor, no or undetermined nodal involvement, no metastasis, Fuhrman grade 2, ECOG PS 1.
z
T4 tumor or any
T stage with nodal involvement, no metastasis, any Fuhrman grade, any ECOG PS. BMI = body mass index; CI = confidence interval; ECOG PS = Eastern
Cooperative Oncology Group performance status; HR = hazard ratio; NLR = neutrophil-to-lymphocyte ratio; UISS = University of California Los Angeles
integrated staging system.
[(Fig._2)TD$FIG]
Time (yr)
1.0
0.9
0.8
0.7
Survival distribution function
0.6
0.5
0.4
0.3
0.2
0.1
0.0
1
3
0
5
2
7
4
9
6
8
Median DFS, yr (95% CI)
Sunitinib 6.2 (4.9–NR)
Placebo 4.0 (2.6–6.0)
p
= 0.04
HR 0.74 (95% CI, 0.55–0.99)
No.atrisk
Sunitinib 194
Placebo
143
134
194
109
110
98
83
89
76
75
60
40
28
10
10
3
2
0
0
Fig. 2
–
Disease-Free survival in patients at higher risk according to blinded independent central review. Higher risk was defined as T3, no or
undetermined nodal involvement, no metastasis, Fuhrman grade 2, ECOG PS 1; or T4 and/or nodal involvement. CI = confidence interval;
HR = hazard ratio; DFS = disease-free survival; ECOG PS = Eastern Cooperative Oncology Group performance status; NR = not reached.
E U R O P E A N U R O L O GY 7 3 ( 2 0 18 ) 6 2
–
6 8
65