


 66 148

demonstrate a 25% improvement in OS (HR 0.8) with a two-
sided
a
value of 0.05 and 80% power would require
approximately 1650 patients and 18.5 yr of follow-up. This
is a conservative estimate that does not account for the
dropouts that are likely in a study that is ongoing over this
time period. Although improving patient OS is a goal of
adjuvant treatment, it is widely understood that for many
indications for which survival is long and/or many
subsequent therapies are available, it is challenging to
measure. Therefore, adjuvant treatments in various tumor
types, including colon cancer, breast cancer, melanoma, and
gastrointestinal stromal tumors, have been approved by
regulatory authorities and implemented as a standard of
care on the basis of relative risk reductions in DFS
or recurrence-free survival with limited or no OS data
[14 – 19]. Approval was based on, among other reasons, the
strength/magnitude of the benefit, positive risk-benefit
assessment, and unmet medical needs. Indeed, for colon
cancer and gastrointestinal stromal tumors, the benefit in
DFS later translated to a benefit in OS
[14 – 16,19,20].
The phase 3 studies ASSURE and S-TRAC assessed the
efficacy of adjuvant sunitinib versus placebo in patients
with RCC, but had different outcomes for the primary
endpoint analysis
[4,21]. In ASSURE, there was no improve-
ment in investigator-assessed DFS
[21], whereas indepen-
dently assessed DFS improved significantly in S-TRAC
[4] .Differences between the ASSURE and S-TRAC studies
are summarized in
Table 3 .In addition to the differences
described therein, the difference in DFS according to
investigator assessment for the placebo arms (median
6.6 yr in ASSURE and 4.5 yr in S-TRAC) illustrates the
differences in the patient populations
[4,21] .One subgroup analysis for ASSURE did not elucidate a
group that benefited from treatment with sunitinib
[22] .However, the differences between ASSURE and
S-TRAC in trial design, patient population, and dosing should
be considered in conglomerate rather than in isolation
[4,21] .For example, owing to the differences in dosing
observed across the two trials, subgroup analyses based on
exposure in ASSURE may not explain the benefit observed in
S-TRAC
[22] .Cross-study comparison between subsets of
patients selected retrospectively from the ASSURE trial and
the primary analysis of S-TRAC must be interpreted with
caution given the many differences between the two trials
and the limitations of such comparisons.
5.
Conclusions
The DFS benefit with adjuvant sunitinib in patients
with locoregional RCC at high risk of tumor recurrence
after nephrectomy as demonstrated in the primary
analysis for S-TRAC was supported by subgroup analyses.
The majority of subgroups experienced longer DFS
with adjuvant sunitinib compared to placebo,
including patients at higher risk of recurrence (T3, no or
Table 2
–
Most common ( 1% of patients in any group) sites of
distant recurrence
Site of relapse
Patients,
n
(%)
Sunitinib (
n
= 309)
Placebo (
n
= 306)
Lung
40 (13)
49 (16)
Lymph node
21 (6.8)
26 (8.5)
Retroperitoneum
16 (5.2)
20 (6.5)
Liver
11 (3.6)
14 (4.6)
Adrenal gland
10 (3.2)
6 (2)
Bone
3 (1)
7 (2.3)
Pancreas
4 (1.3)
5 (1.6)
Brain
3 (1)
4 (1.3)
Peritoneum/omentum
3 (1)
4 (1.3)
Mediastinum
1 (0.3)
4 (1.3)
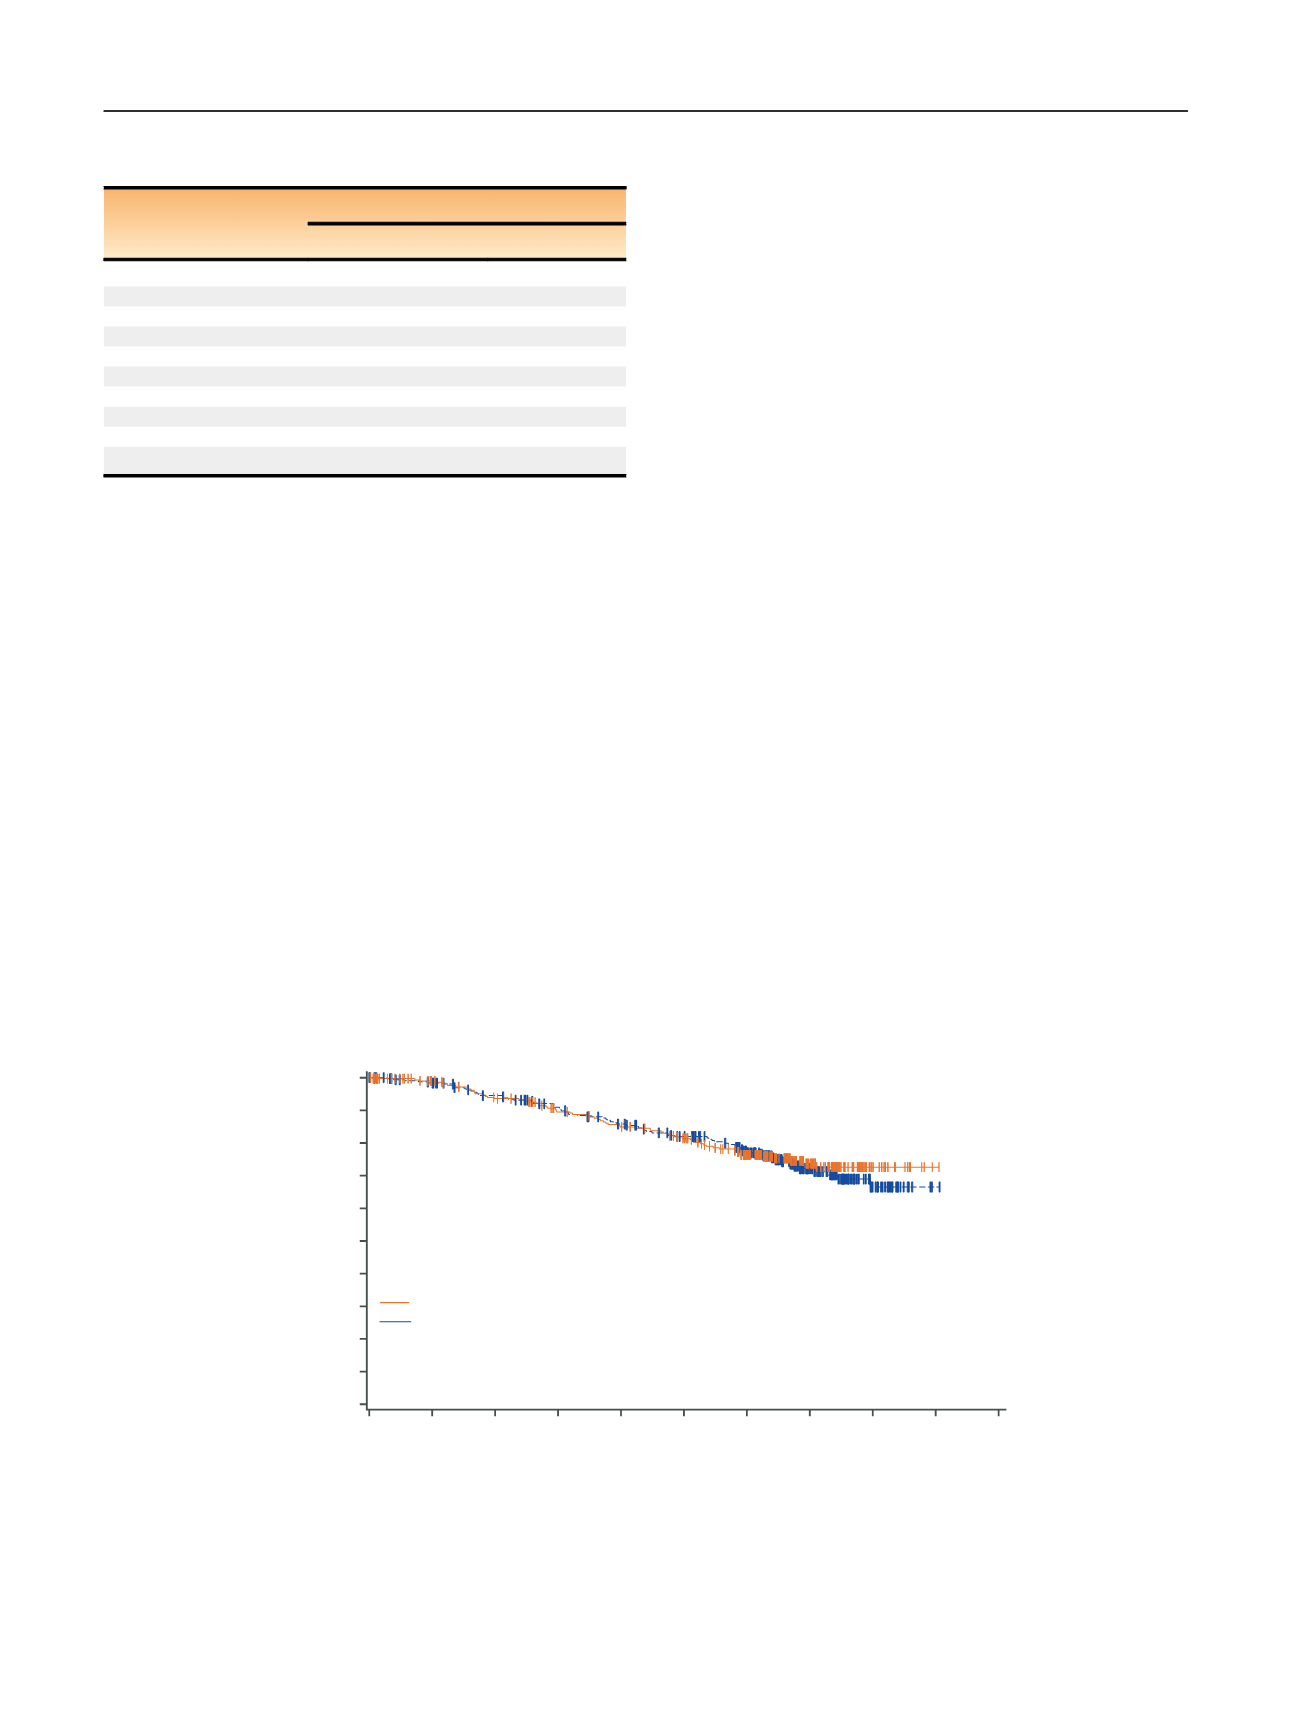
[(Fig._3)TD$FIG]
Time (yr)
1.0
0.9
0.8
0.7
Survival distribution function
0.6
0.5
0.4
0.3
0.2
0.1
0.0
0
1
2
3
4
5
6
7
8
9
10
Median OS (95% CI)
Sunitinib NR (NR–NR)
Placebo NR (NR–NR)
p
= 0.61*
HR 0.92 (95% CI, 0.66–1.28)
No. at risk
Sunitinib
Placebo
278
289
309
306
258
269
236
250
222
231
205
210
160
172
82
82
16
23
1
1
0
0
Fig. 3
–
Kaplan-Meier estimates of overall survival (OS) in the intent-to-treat population. * Two-sided
p
value from log-rank test stratified by University
of California, Los Angeles integrated staging system high-risk group: T3 or T4, no or undetermined nodal involvement, no metastasis, or any T stage
with local nodal involvement, and for all patients, any Fuhrman grade and any Eastern Cooperative Oncology Group performance status.
CI = confidence interval; ECOG PS = Eastern Cooperative Oncology Group performance status; HR = hazard ratio; NR = not reached.
E U R O P E A N U R O L O GY 7 3 ( 2 0 18 ) 6 2
–
6 8
66