


 146 148

evaluation criteria. Larger, prospective studies are needed to
confirm our findings.
Conflicts of interest:
The authors have nothing to disclose.
Appendix A. Supplementary data
Supplementary data associated with this article can be
found, in the online version, at
http://dx.doi.org/10.1016/j. eururo.2017.09.024 .References
[1]
Fernando A, Pattison J, Hors fi eld C, D ’ Cruz D, Cook G, O ’ Brien T. [ 18 F]- Fluorodeoxyglucose positron emission tomography in the diagnosis, treatment strati fi cation, and monitoring of patients with retroperito- neal fi brosis: a prospective clinical study. Eur Urol 2017;71:926 – 33.
[2]
Salvarani C, Pipitone N, Versari A, et al. Positron emission tomogra- phy (PET): evaluation of chronic periaortitis. Arthritis Rheum 2005; 53:298 – 303.
[3]
Vaglio A, Palmisano A, Alberici F, et al. Prednisone versus tamoxifen in patients with idiopathic retroperitoneal fi brosis: an open-label randomised controlled trial. Lancet 2011;378:338 – 46.
[4]
Wahl RL, Jacene H, Kasamon Y, Lodge MA. From RECIST to PERCIST: evolving considerations for PET response criteria in solid tumors. J Nucl Med 2009;50(Suppl 1):122S – 50S.
[5]
JansenI,HendrikszTR,HanSH,HuiskesAW,vanBommelEF. 18 F-Fluor- odeoxyglucose position emission tomography (FDG-PET) for moni- toring disease activity and treatment response in idiopathic retroperitoneal fi brosis. Eur J Intern Med 2010;21:216 – 21.
Nephrology Unit, University Hospital, Parma, Italy
*Corresponding author. Unità Operativa di Nefrologia, Azienda
Ospedaliero-Universitaria di Parma, Via Gramsci 14, 43126 Parma, Italy.
Tel. +39 05 21702013; Fax: +39 05 21033185.
E-mail address:
augusto.vaglio@virgilio.it(A. Vaglio).
September 23, 2017
http://dx.doi.org/10.1016/j.eururo.2017.09.024[(Fig._1)TD$FIG]
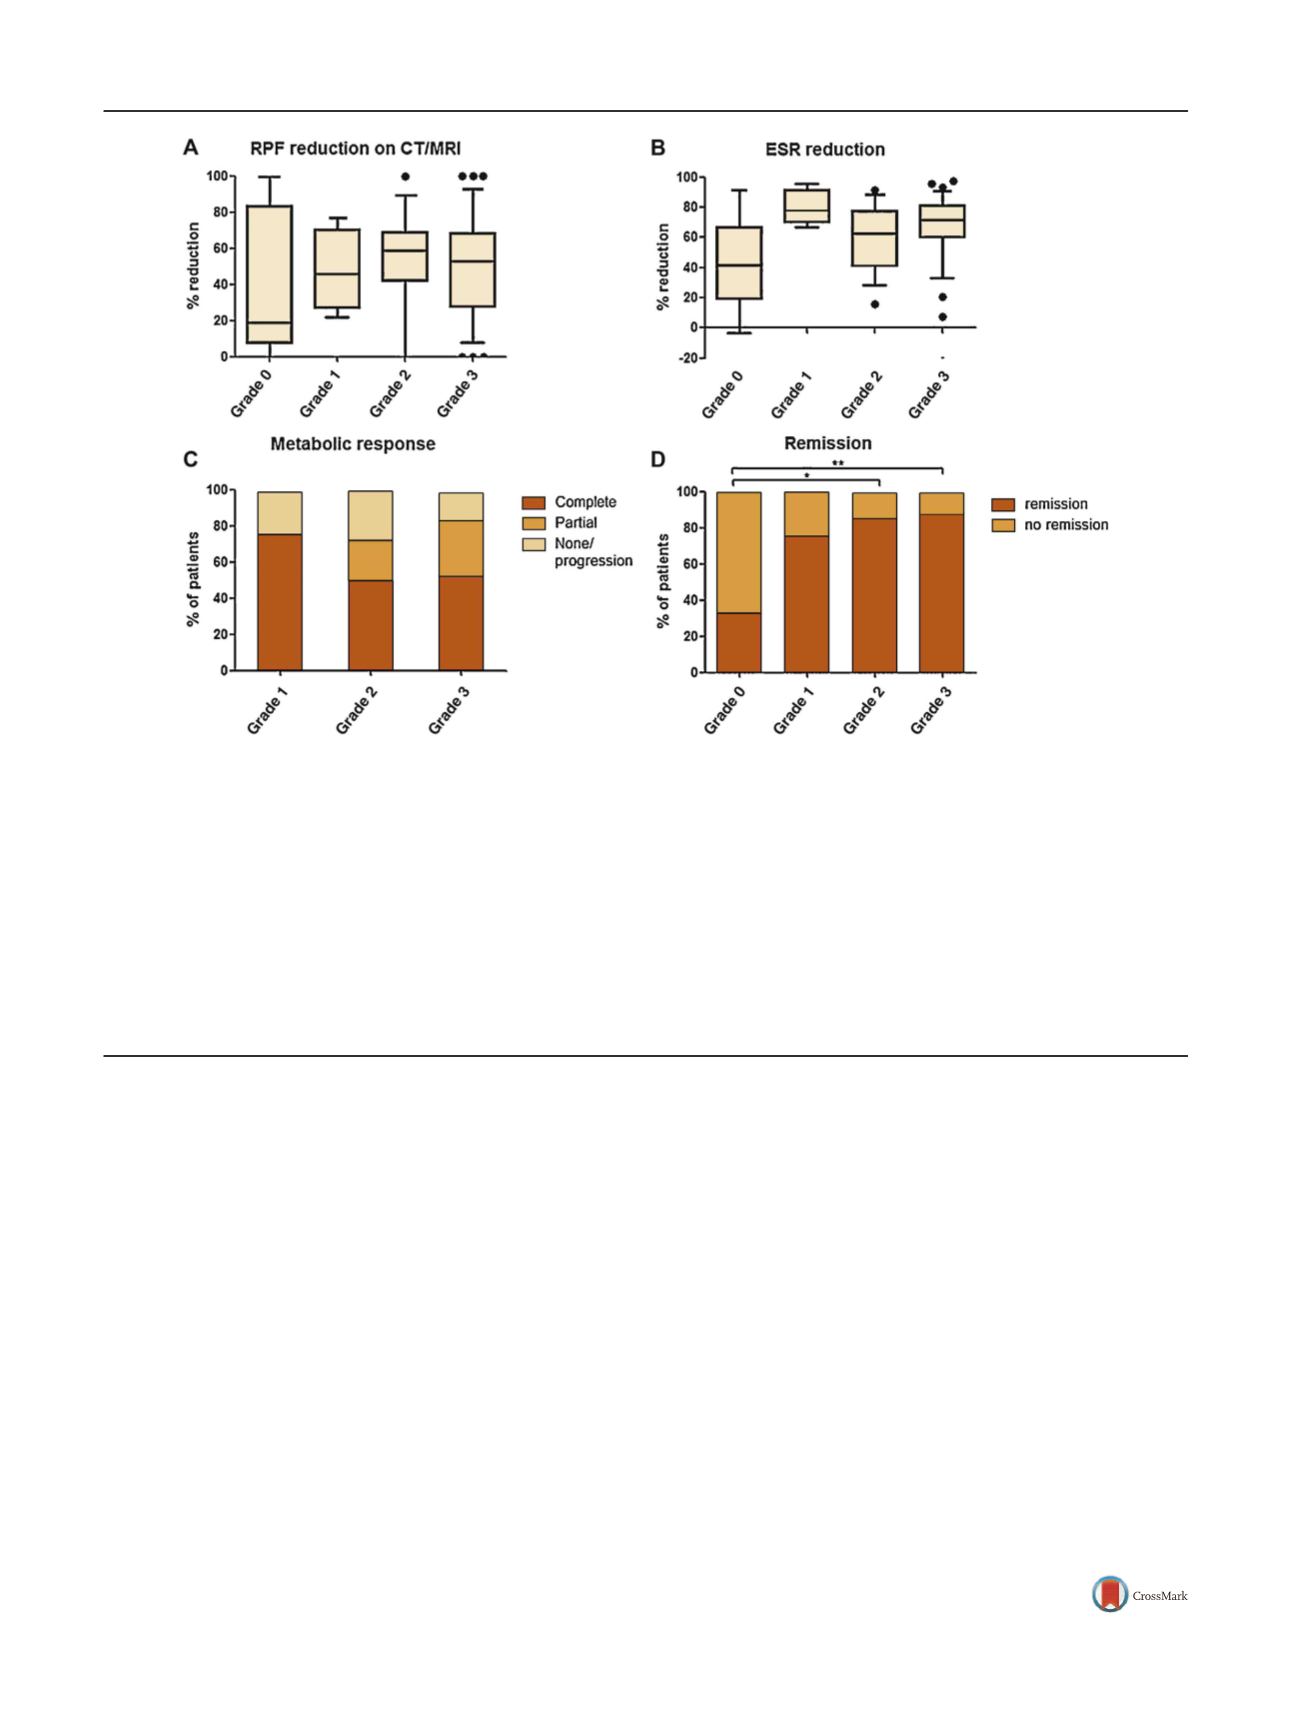
Fig. 1
–
Response to treatment in patients with retroperitoneal fibrosis (RPF) with different grades of fluorodeoxyglucose (FDG) uptake at baseline. (A)
Percentage reduction (end of treatment vs baseline) in RPF maximal thickness measured on computed tomography or magnetic resonance imaging in
patients with different grades of FDG uptake at baseline positron emission tomography (PET). The number of patients in the different groups is
reported in the text. No significant differences were found between the groups. (B) Percentage reduction in erythrocyte sedimentation rate (ESR) (end
of treatment vs baseline). No significant differences were found; only the difference between grade 0 and grade 3 was of borderline statistical
significance (
p
= 0.08). (C) Rates of metabolic responses in patients with positive FDG-PET at baseline (uptake grades 1
–
3). Metabolic responses were
graded generally following the PERCIST criteria
[4]as follows: complete (complete resolution of FDG uptake), partial (decline of at least 30% in FDG
uptake), no response/stable metabolic disease (neither partial metabolic response nor progressive metabolic disease), or progressive metabolic disease
(increase of at least 30% in target lesion activity or appearance of new areas of uptake). There were no significant differences in the frequency of
metabolic responses between patients with different grades of FDG-PET positivity at baseline. (D) Rates of remission in patients with different grades
of FDG uptake at baseline PET. Remission was a composite endpoint (as defined in ref.
[3]) including the disappearance of disease-related symptoms,
resolution of ureteral obstruction, and normalisation of acute-phase reactants. Patients with grade 0 uptake had a lower remission rate compared to
patients with grade 2 (*
p
= 0.02) and grade 3 (**
p
= 0.01) uptake. Continuous and categorical variables were compared between groups using the Mann-
Whitney
U
test and Fisher's exact test, respectively, with
p
<
0.05 considered statistically significant. In box plots, the line indicates the median, boxes
the 25th
–
75th percentiles, whiskers the 10th
–
90th percentiles, and dots the outliers.
E U R O P E A N U R O L O GY 7 3 ( 2 0 18 ) 14 5
–
14 8
146