


 74 148

[(Fig._1)TD$FIG]
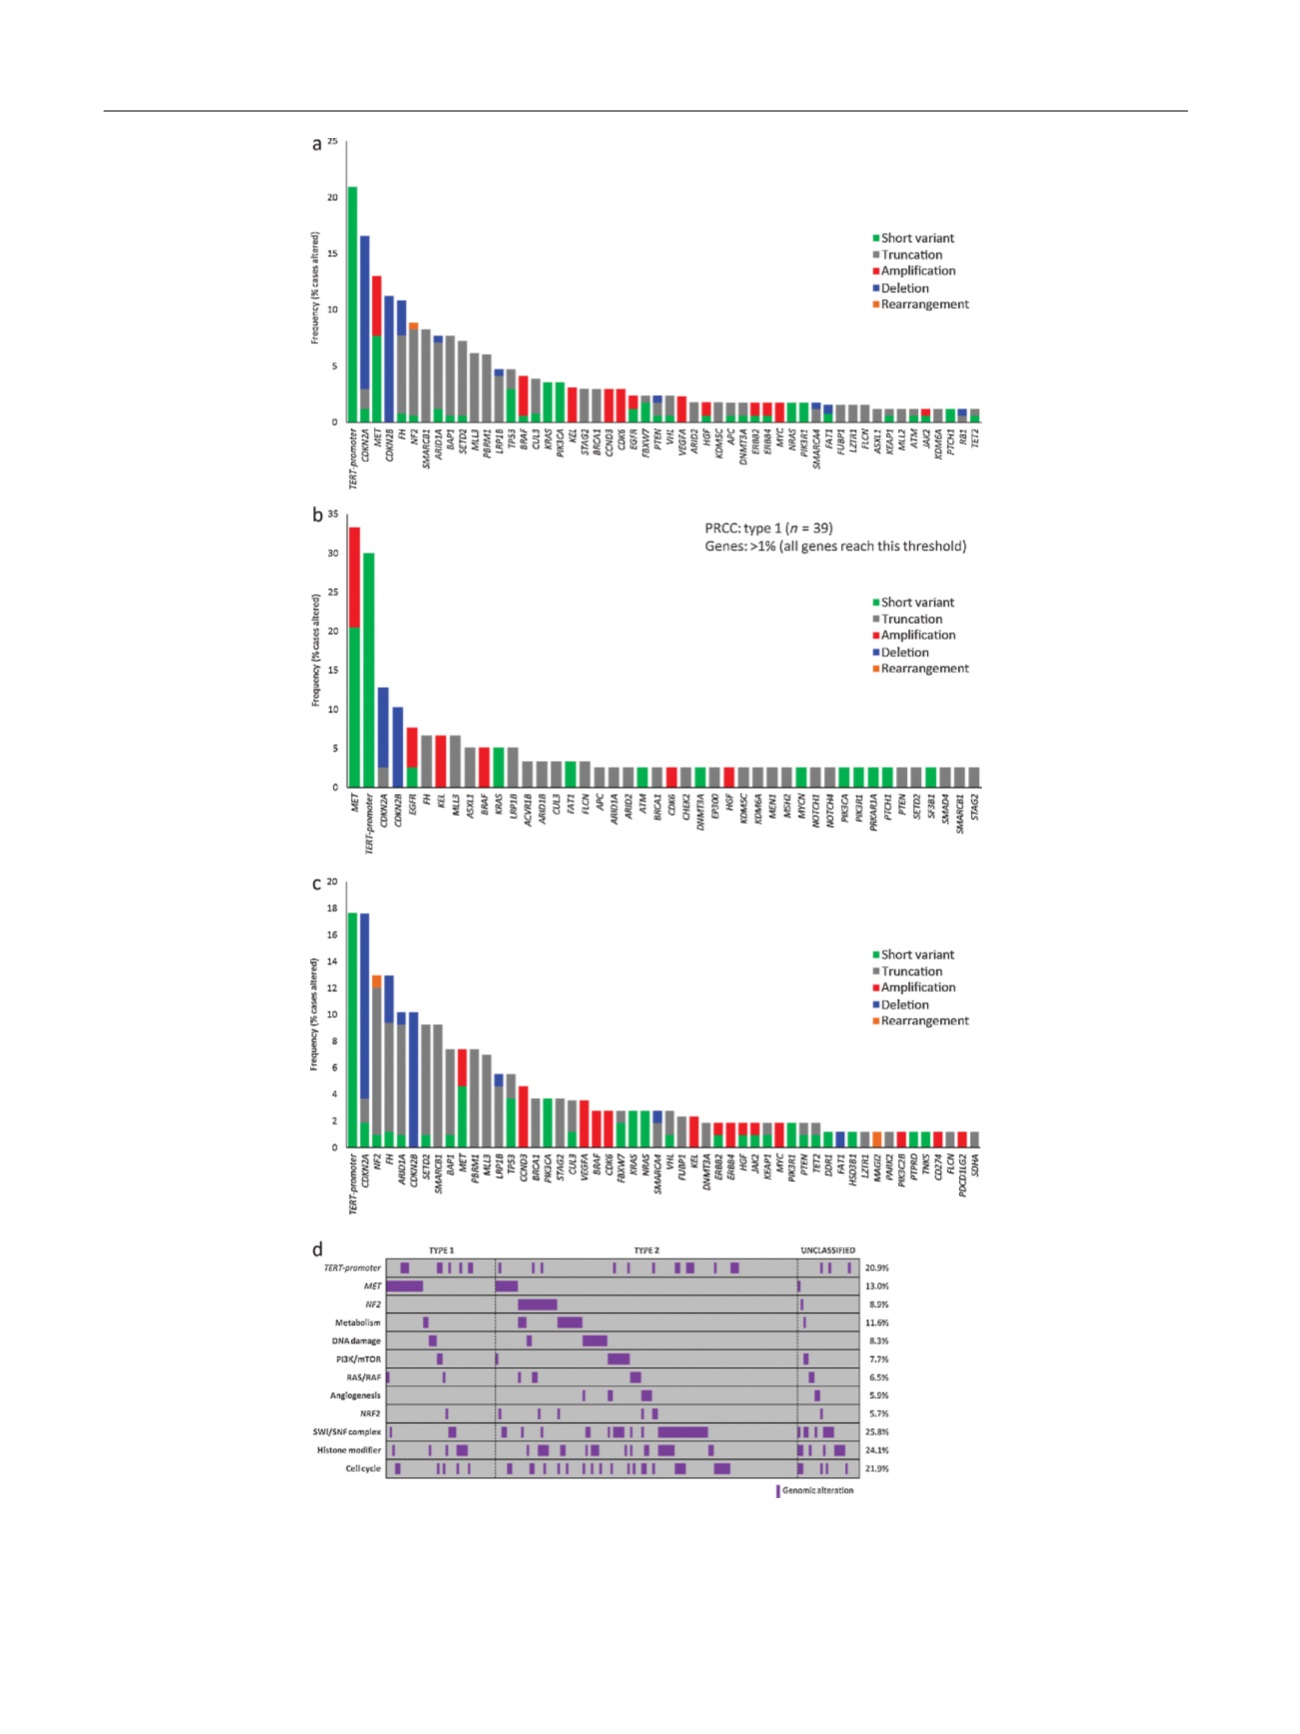
Fig. 1 – Long-tail plots outlining genomic alterations in (A) the overall cohort (
n
= 169), (B) type 1 papillary renal cell carcinoma (PRCC) (
n
= 39), and
(C) type 2 PRCC (
n
= 108). (D) Gene and pathway analysis segregated by PRCC subtype; genes are in italics and pathways are in bold. Pathway
definitions are: metabolism (
FH, IDH2, SDHA
GA), DNA damage (
ATM, BARD1, BRCA1/2, BRIP1, CHEK2, FANCD2, FANCG, RAD51C)
, PI3K/mTOR (
PTEN,
PIK3CA, PIK3R1, TSC2, MTOR
), RAS/RAF (short variants in
NF1, KRAS, NRAS, BRAF
), angiogenesis (
FLT1, FLT4, VEGFA, VHL
), NRF2 (
CUL3, KEAP1, NFE2L2
),
SWI/SNF (
SMARCB1, SMARCA4, PBRM1, ARID1A, ARID1B, ARID2
), histone modifier (
ASXL1, BAP1, CREBBP, EP300, KDM5C, KDM6A, MLL2, MLL3, SETD2
),
and cell cycle (
CDKN2A/B, CDK4, CDK6, CCND3, RB1
).
E U R O P E A N U R O L O G Y 7 3 ( 2 0 1 8 ) 7 1 – 7 8
74