


 84 148

The MRI characteristics are shown in
Table 3 .Six studies
used 3-T scanners, two used 1.5-T scanners, and two used
1.5- or 3-T scanners. Regarding coverage of MRI, four
studies used whole-body MRI, two assessed the axial
skeleton, and four covered only the pelvis using a routine
prostate MRI protocol. A combination of DWI and conven-
tional sequences (T1WI, T2WI, and/or STIR) was used in five
studies, only DWI in one study, and only conventional
sequences in four studies. The criteria for bone metastasis
were explicit in seven studies; however, three studies were
not clear on this issue as one study was not explicit
regarding the role of T1WI and STIR, another study did not
provide any criteria, and the other simply stated the use of a
five-point Likert scale.
3.3.
Quality assessment
Overall, the quality of the studies was considered moderate,
with eight of the 10 studies satisfying at least four of the
seven QUADAS-2 domains
( Fig. 2). Regarding the patient
selection domain, one study was considered to have a high
risk of bias due to a nonconsecutive case/control design
[[10_TD$DIFF]
19]. In addition, one study was considered to have an
unclear risk of bias, as it did not explicitly mention whether
patient enrollment was consecutive or not
[9] .There was
high concern for applicability in one study, as it included
patients with no metastasis or oligometastasis (
<
5 metas-
tases) based on conventional imaging and excluding those
with polimetastasis
[[6_TD$DIFF]
15]. Regarding the index test domain,
there was an unclear risk of bias in four studies, as it was
unclear whether MRI was evaluated blinded to the
reference standard in one study
[9]and whether a
prespecified threshold was used in three studies
[[23_TD$DIFF]
15,16,19] .There was low concern for applicability in all
10 studies. Regarding the reference standard domain, all the
studies had an unclear risk of bias, as it was unclear whether
the derivation of the reference standard was blinded to MRI.
There was unclear concern for applicability in three studies,
as they did not explicitly mention whether MRI–reference
standard interval was at least 6 mo when BVC was used as
the reference standard
[[24_TD$DIFF]
6,15,20]. Regarding the flow and
timing domain, three studies had a high risk of bias as
different reference standards were applied within the study
[[25_TD$DIFF]
4,6,16,19] .Two studies were considered to have an unclear
risk of bias as the MRI–reference standard interval was not
provided
[[26_TD$DIFF]
15,20].
3.4.
Diagnostic accuracy
The sensitivity and specificity of the 10 individual studies
were 72–100% and 70–100%, respectively. Although the
Cochran’s
Q
test suggested that heterogeneity was not
present (
Q
= 2.970,
p
= 0.113), the Higgins
I
2
[21_TD$DIFF]
statistics
demonstrated substantial heterogeneity with regard to
both sensitivity (
I
2
= 81.44%) and specificity (
I
2
= 85.85%).
No threshold effect was shown upon visualization of the
coupled forest plot of sensitivity and specificity
( Fig. 3), with
a correlation coefficient between sensitivity and false
positive rate of –0.581 (95% confidence interval [CI] –
0.886 to 0.077).
For all 10 studies combined, the pooled sensitivity and
specificity were 0.96 (95% CI 0.87–0.99) and 0.98 (95% CI
0.93–0.99), respectively. In the HSROC curve, there was a
large difference between the 95% confidence and prediction
regions, additionally indicating that heterogeneity was
present between the studies
( Fig. 4). The area under the
HSROC curve was 0.99 (95% CI 0.98–1.00). According to the
Deeks et al’s
[13]funnel plot, the likelihood of publication
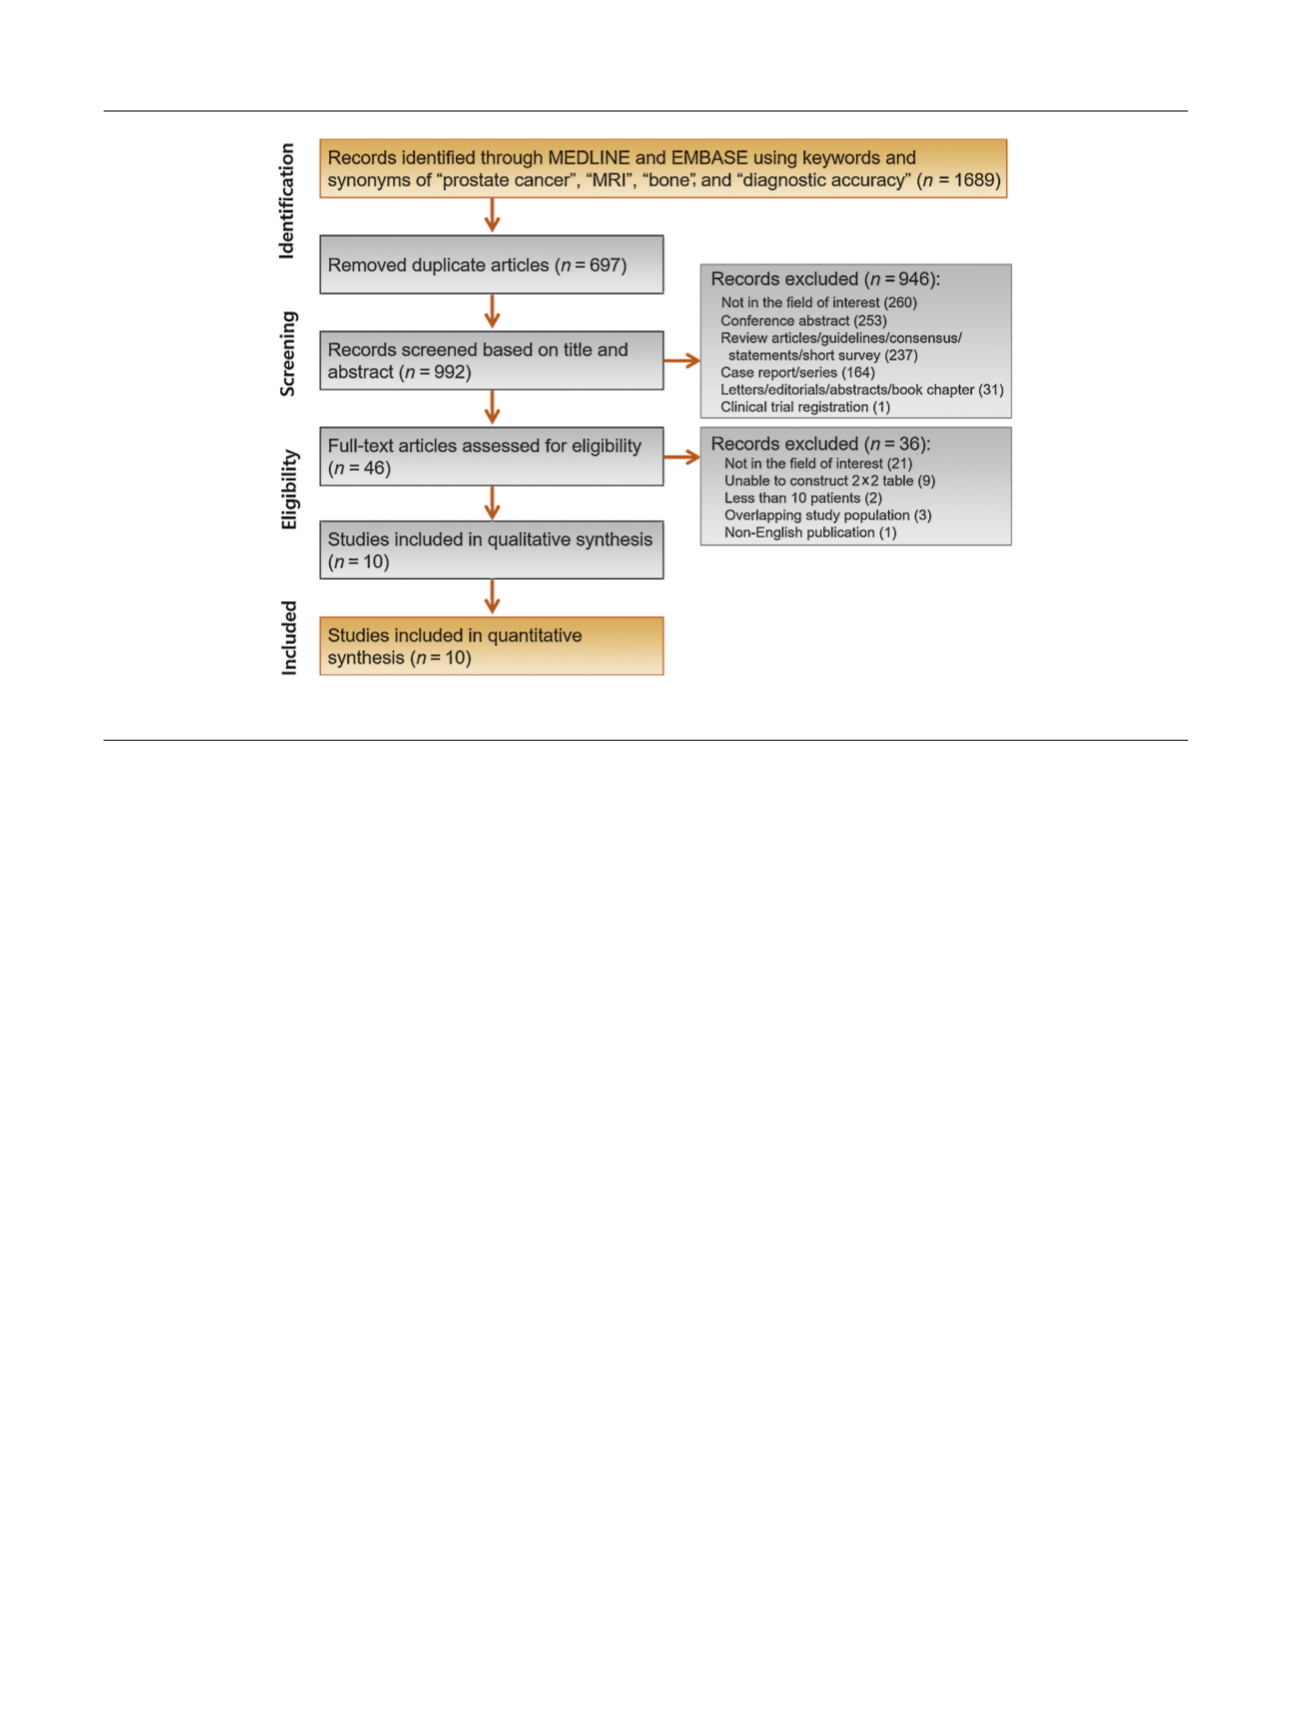
[(Fig._1)TD$FIG]
Fig. 1 – Flow diagram showing study selection process for meta-analysis. MRI = magnetic resonance imaging.
E U R O P E A N U R O L O G Y 7 3 ( 2 0 1 8 ) 8 1 – 9 1
84