


 89 148

The clinical setting (newly diagnosed or treated prostate
cancer) is a major factor when determining bone metastasis
in prostate cancer patients. Although not significant at
[14_TD$DIFF]
meta-
regression analysis, sensitivity analysis showed that studies
including only treated prostate cancer patients showed a
tendency for lower sensitivity compared with those includ-
ing only patients with newly diagnosed prostate cancer
(0.89 vs 0.93). We speculate that in patients who have
already received systemic treatment (ie, androgen depriva-
tion therapy), the imaging characteristics of metastatic bone
lesions may have changed compared with the original (or
pretreatment) appearance, thereby hindering accurate
detection
[[31_TD$DIFF]
25,26] .This may not be applicable for patients
treated with local therapy such as RP; however, we were
unable to perform separate analyses according to the type of
treatment as the included studies did not provide separate
diagnostic performance values. Another aspect of clinical
setting is the risk stratification for possibility of bone
metastasis. Guidelines recommend that screening for bone
metastasis be performed in high-risk patients
[2]. Based on
sensitivity analysis, the pooled sensitivity and specificity
were comparable in studies including only high-risk patients
(0.95 and 0.93, respectively), in studies on patients with any
risk (0.91 and 0.99, respectively), and for all 10 studies
(0.96 and 0.98, respectively). However, one study included
only patients with no or less than five metastatic bone
lesions based on conventional imaging, and reported
distinctively inferior diagnostic performance compared with
the other nine studies (sensitivity of 0.72 and specificity of
0.70). This study was considered to have high concern for
applicability as in real-life clinical practice; metastatic
screening would not be employed for patients with low or
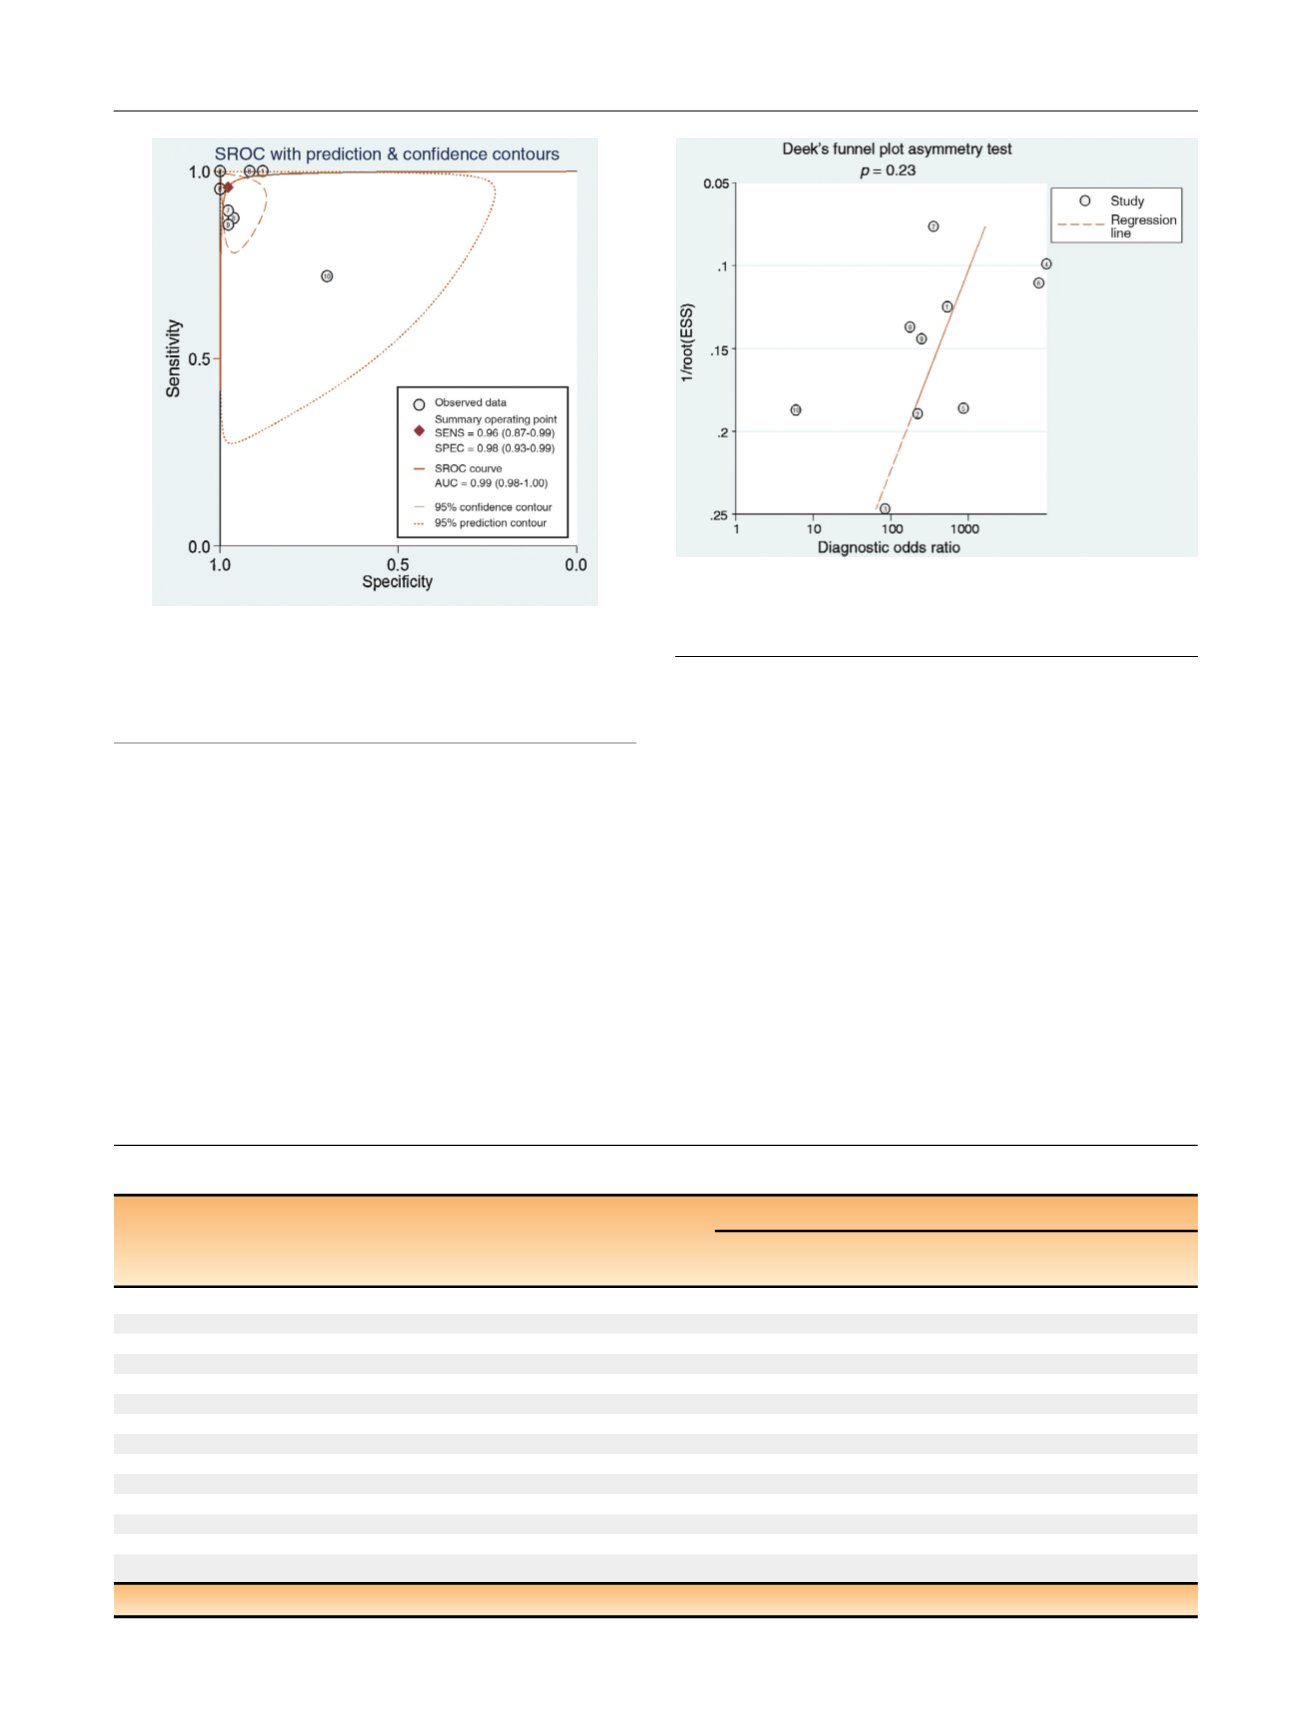
[(Fig._4)TD$FIG]
Fig. 4 – Hierarchical summary receiver operating characteristic curve of
the diagnostic performance of MRI for detection of bone metastasis in
patients with prostate cancer. AUC = area under the curve;
MRI = magnetic resonance imaging; SENS = sensitivity; SPEC = specificity;
SROC = summary receiver operating characteristic.
[(Fig._5)TD$FIG]
Fig. 5 – Deeks et al’s
[[4_TD$DIFF]
13]funnel plot for per-patient analysis. A
p
value
of 0.23 suggests that the likelihood of publication bias is
low
[5_TD$DIFF]
. ESS = effective sample size.
Table 4 – Results of
[14_TD$DIFF]
meta-regression analysis of MRI for the detection of bone metastasis in patients with prostate cancer
Covariates
Subgroup
Meta-analytic summary estimates
Sensitivity
(95% CI)
Specificity
(95% CI)
p
Clinical setting
Newly diagnosed
0.97 (0.93–1.00)
0.96 (0.91–1.00)
0.10
Treated
0.93 (0.83–1.00)
0.99 (0.97–1.00)
Reference standard
BVC only
0.96 (0.87–1.00)
0.98 (0.95–1.00)
0.86
BVC or histopathology
0.95 (0.88–1.00)
0.98 (0.95–1.00)
Magnetic field strength
3 T used
0.95 (0.87–1.00)
0.99 (0.98–1.00)
0.08
1.5 T only
0.96 (0.91–1.00)
0.95 (0.89–1.00)
MRI coverage
Pelvis
0.94 (0.86–1.00)
0.99 (0.97–1.00)
0.34
Axial skeleton or whole body
0.97 (0.92–1.00)
0.96 (0.91–1.00)
MRI sequence
DWI used
0.96 (0.89–1.00)
0.99 (0.96–1.00)
0.68
Conventional sequences only
0.95 (0.89–1.00)
0.96 (0.90–1.00)
Number of imaging planes
2
0.99 (0.98–1.00)
0.99 (0.98–1.00)
<
0.01
1
0.87 (0.80–0.94)
0.95 (0.90–1.00)
Minimum slice thickness
4 mm
0.96 (0.88–1.00)
0.99 (0.98–1.00)
0.18
>
4 mm
0.96 (0.90–1.00)
0.96 (0.91–1.00)
BVC = best value comparator; CI = confidence interval; DWI = diffusion-weighted imaging; MRI = magnetic resonance imaging.
E U R O P E A N U R O L O G Y 7 3 ( 2 0 1 8 ) 8 1 – 9 1
89