


 88 148

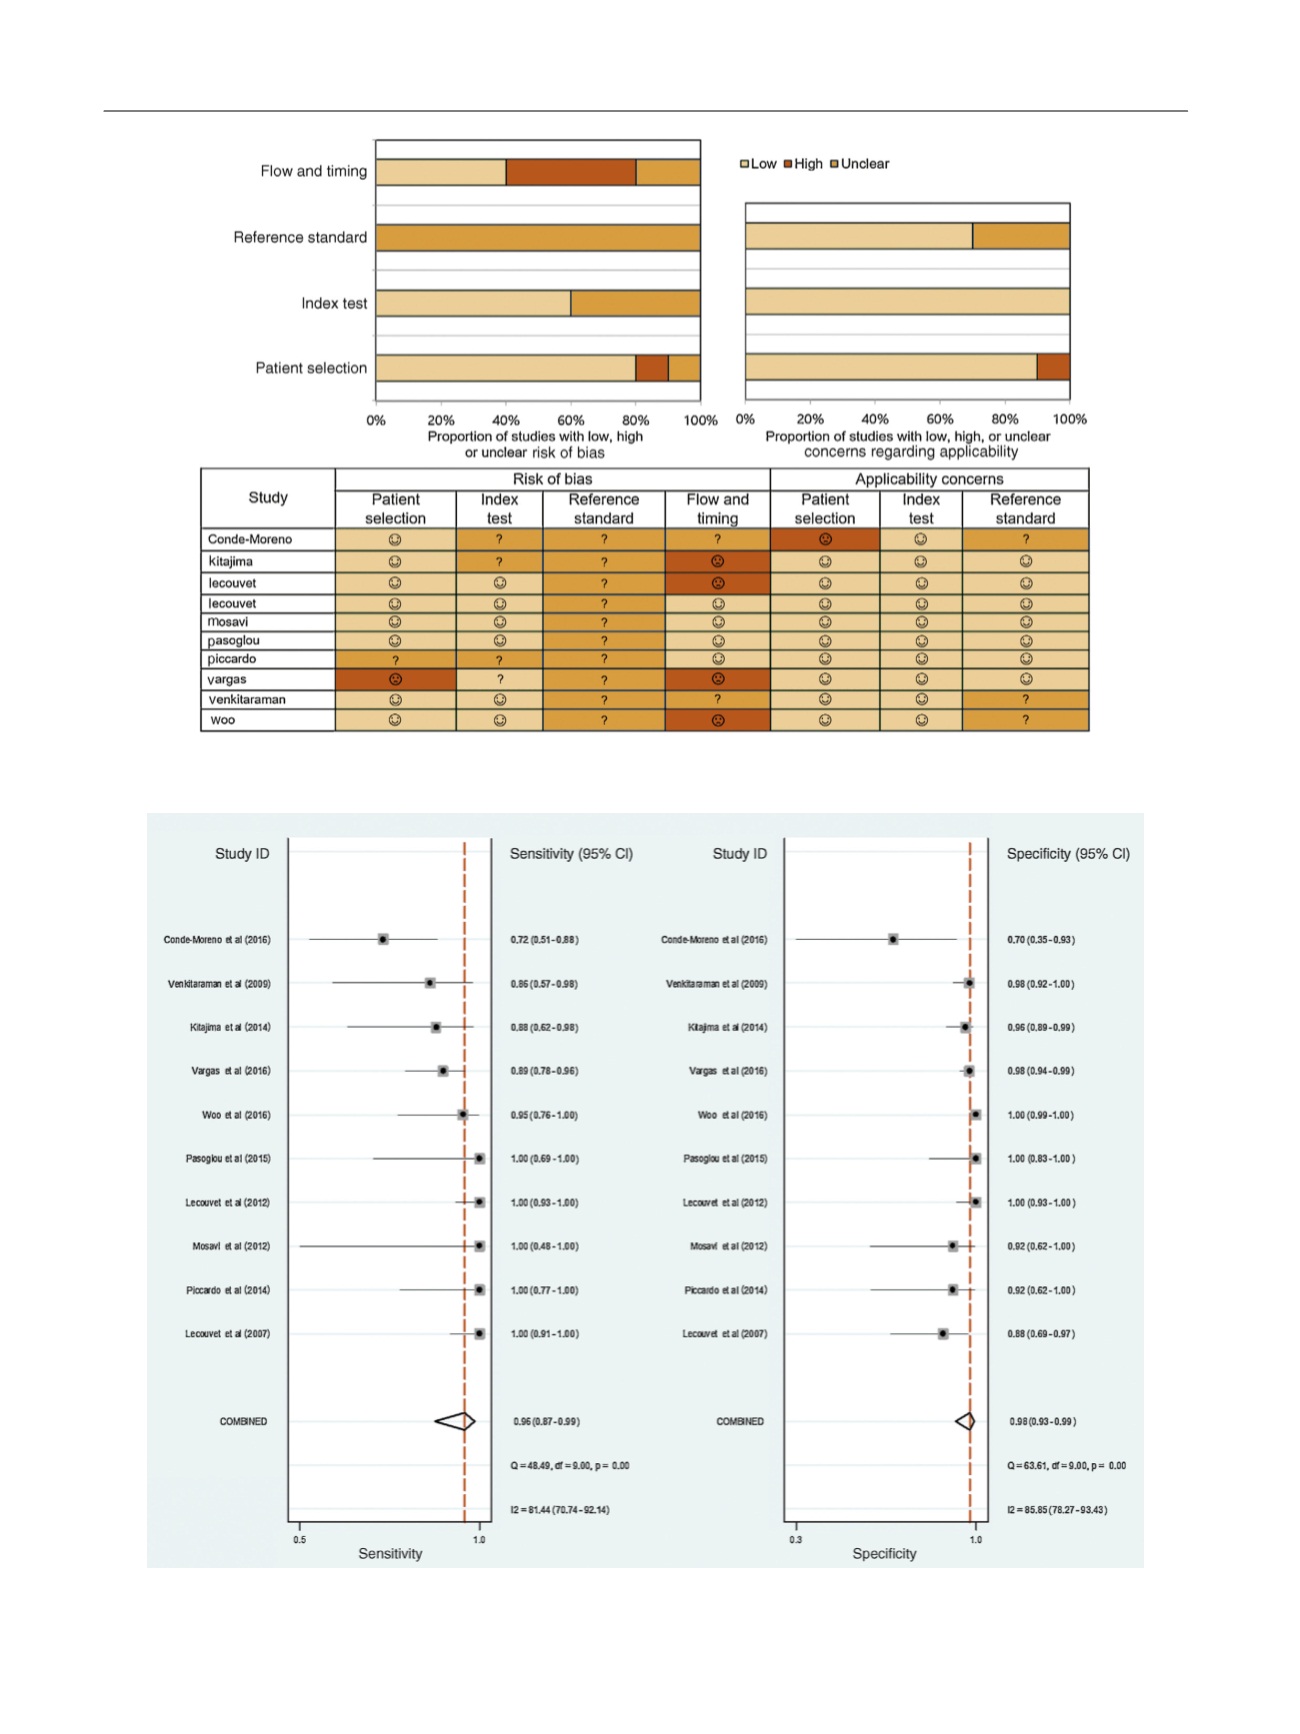
[(Fig._2)TD$FIG]
Fig. 2 – Grouped bar charts showing risk of bias (left) and concerns for applicability (right) of 10 included studies using QUADAS-2. QUADAS-2 = Quality
Assessment of Diagnostic Accuracy Studies-2.
[(Fig._3)TD$FIG]
Fig. 3 – Coupled forest plots of pooled sensitivity and specificity. Numbers are pooled estimates with 95% CIs in parentheses. Corresponding
heterogeneity statistics are provided at bottom right corners. Horizontal lines indicate 95% CIs. CI = confidence interval.
E U R O P E A N U R O L O G Y 7 3 ( 2 0 1 8 ) 8 1 – 9 1
88