


 135 148

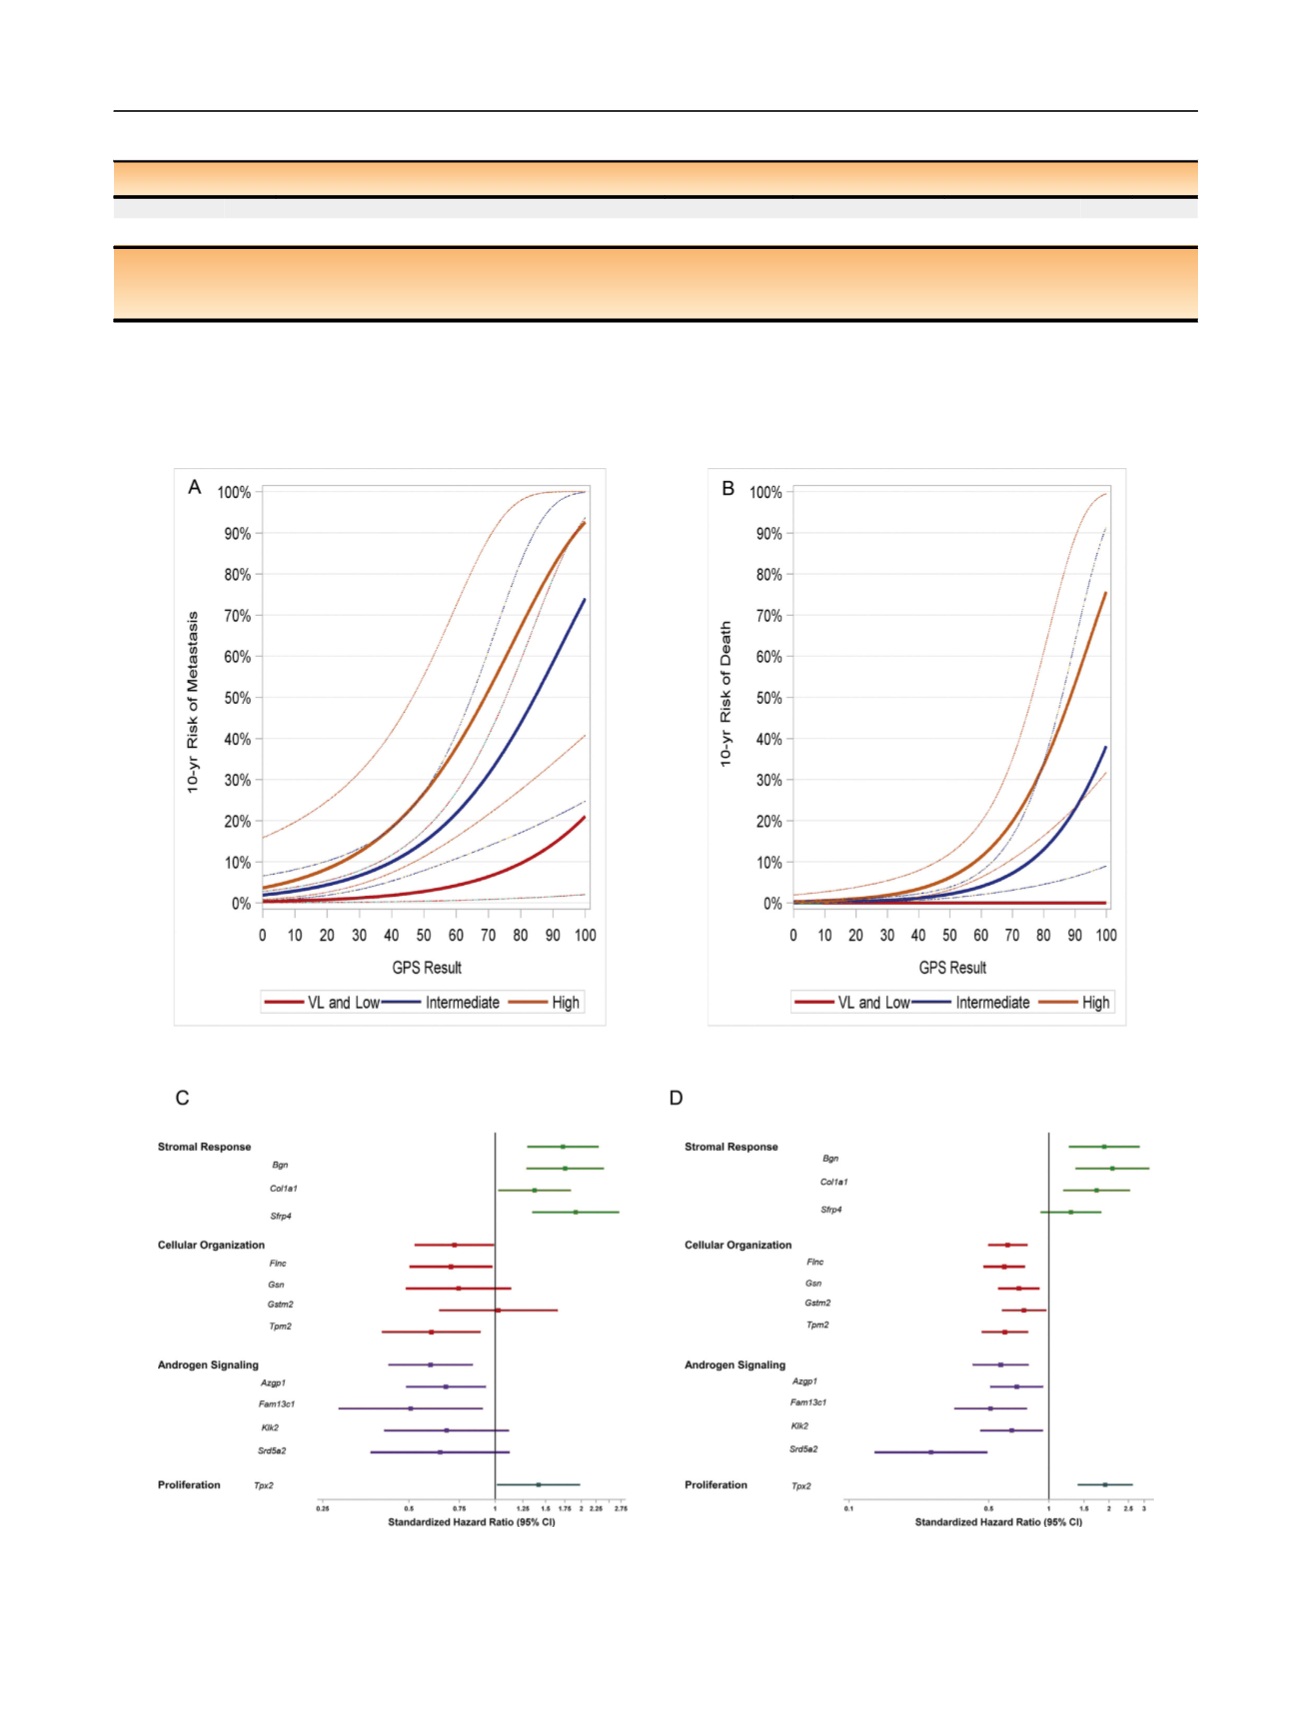
Table 2 (
Continued
)
Model
Variable
N
HR
HR 95% CI
p
value
8 + vs 6
5.74
(2.11
–
15.58)
0.001
PSA at diagnosis
1.02
(1.01
–
1.02)
<
0.001
AUA = American Urological Association; BCR = biochemical recurrence; Bx = biopsy; CAPRA = Cancer of the Prostate Risk Assessment; CI = con
fi
dence interval;
GPS = Genomic Prostate Score; HR = hazard ratio; NCCN = National Comprehensive Cancer Network; PCD = prostate cancer
–
speci
fi
c death; PSA = prostate-
speci
fi
c antigen.
Fig. 3
–
Risk profiles of clinical outcome as a continuous function of GPS: (A) 10-yr risk of distant metastasis by the NCCN risk group and (B) 10-yr risk
of PCD by the NCCN risk group. GPS gene groups and individual genes predicting metastasis and PCD: (C) association of gene groups and individual
genes with in GPS and metastasis, and (D) association of gene groups and individual genes within GPS and PCD. CI = confidence interval;
GPS = Genomic Prostate Score; NCCN = National Comprehensive Cancer Network; PCD = prostate cancer
–
specific death; VL = very low.
E U R O P E A N U R O L O GY 7 3 ( 2 0 18 ) 12 9
–
13 8
135