


 131 148

greatest length of tumor representative of the overall tumor grade was
sectioned of testing. Biopsy tissue sections submitted to the Genomic
Health Clinical Laboratory were manually microdissected and RNA
extracted as previously described
[7,8] .2.5.
Assay methods
RNA from each specimen was tested using an analytically validated
17-gene quantitative reverse transcription polymerase chain reaction
assay, which provides a GPS (scale 0
–
100) as a measure of tumor
aggressiveness. All analytical methods were prede
fi
ned and performed
as previously described
[6,7] .Expression of 12 cancer genes was
normalized relative to
fi
ve reference genes and used to calculate the GPS.
2.6.
Statistical methods
All analyses were detailed in a prespeci
fi
ed statistical analysis plan (see
the Supplementary material). The co-primary clinical end points were
time to metastases and time to PCD. A secondary clinical end point was
time to BCR. Additional speci
fi
ed analyses included strati
fi
cation by
clinical stage, biopsy GS, and clinical risk groups.
In the analyses of each outcome of interest, follow-up began on the
date of initial diagnostic biopsy and ended on either the date of event (eg,
metastasis, PCD, or BCR), disenrollment fromKPNC, nonprostate primary
cancer, or death due to other cause or the date December 31, 2015,
whichever came
fi
rst.
Weighted descriptive statistics and weighted proportions were
reported for demographic and clinicopathological characteristics, and
chi-square and Wilcoxon tests were used to compare the evaluable
cohort and nonselected samples, based on the prespeci
fi
ed cohort
sampling schema. Cox proportional hazard (PH) models were used to
evaluate the association of GPS with the three end points
[12,15]. Re-
gression parameters (hazard ratios [HRs] and 95% con
fi
dence intervals
[CIs]) were estimated by weighted pseudopartial likelihood
[12] .The
p
value for the test of associationwas calculated using a weighted Wald
’
s
test
[12]. The two primary objectives were tested in sequence, and the
overall family-wise error rate was preserved at 0.05 signi
fi
cance level
[16]. The PH assumption was evaluated and the linearity assumption for
the predictors was assessed by Martingale residuals
[17,18].
GPS was treated as a continuous variable in regression analyses.
Consistent with two prior clinical validation studies
[7,8] ,HRs for GPS
were calculated per 20 units. Area under the curve for the receiver
operating characteristic (ROC) curve was calculated.
Analyses were performed independently by KPNC Division of
Research and Genomic Health, using SAS version 9.3.
3.
Results
3.1.
Study population
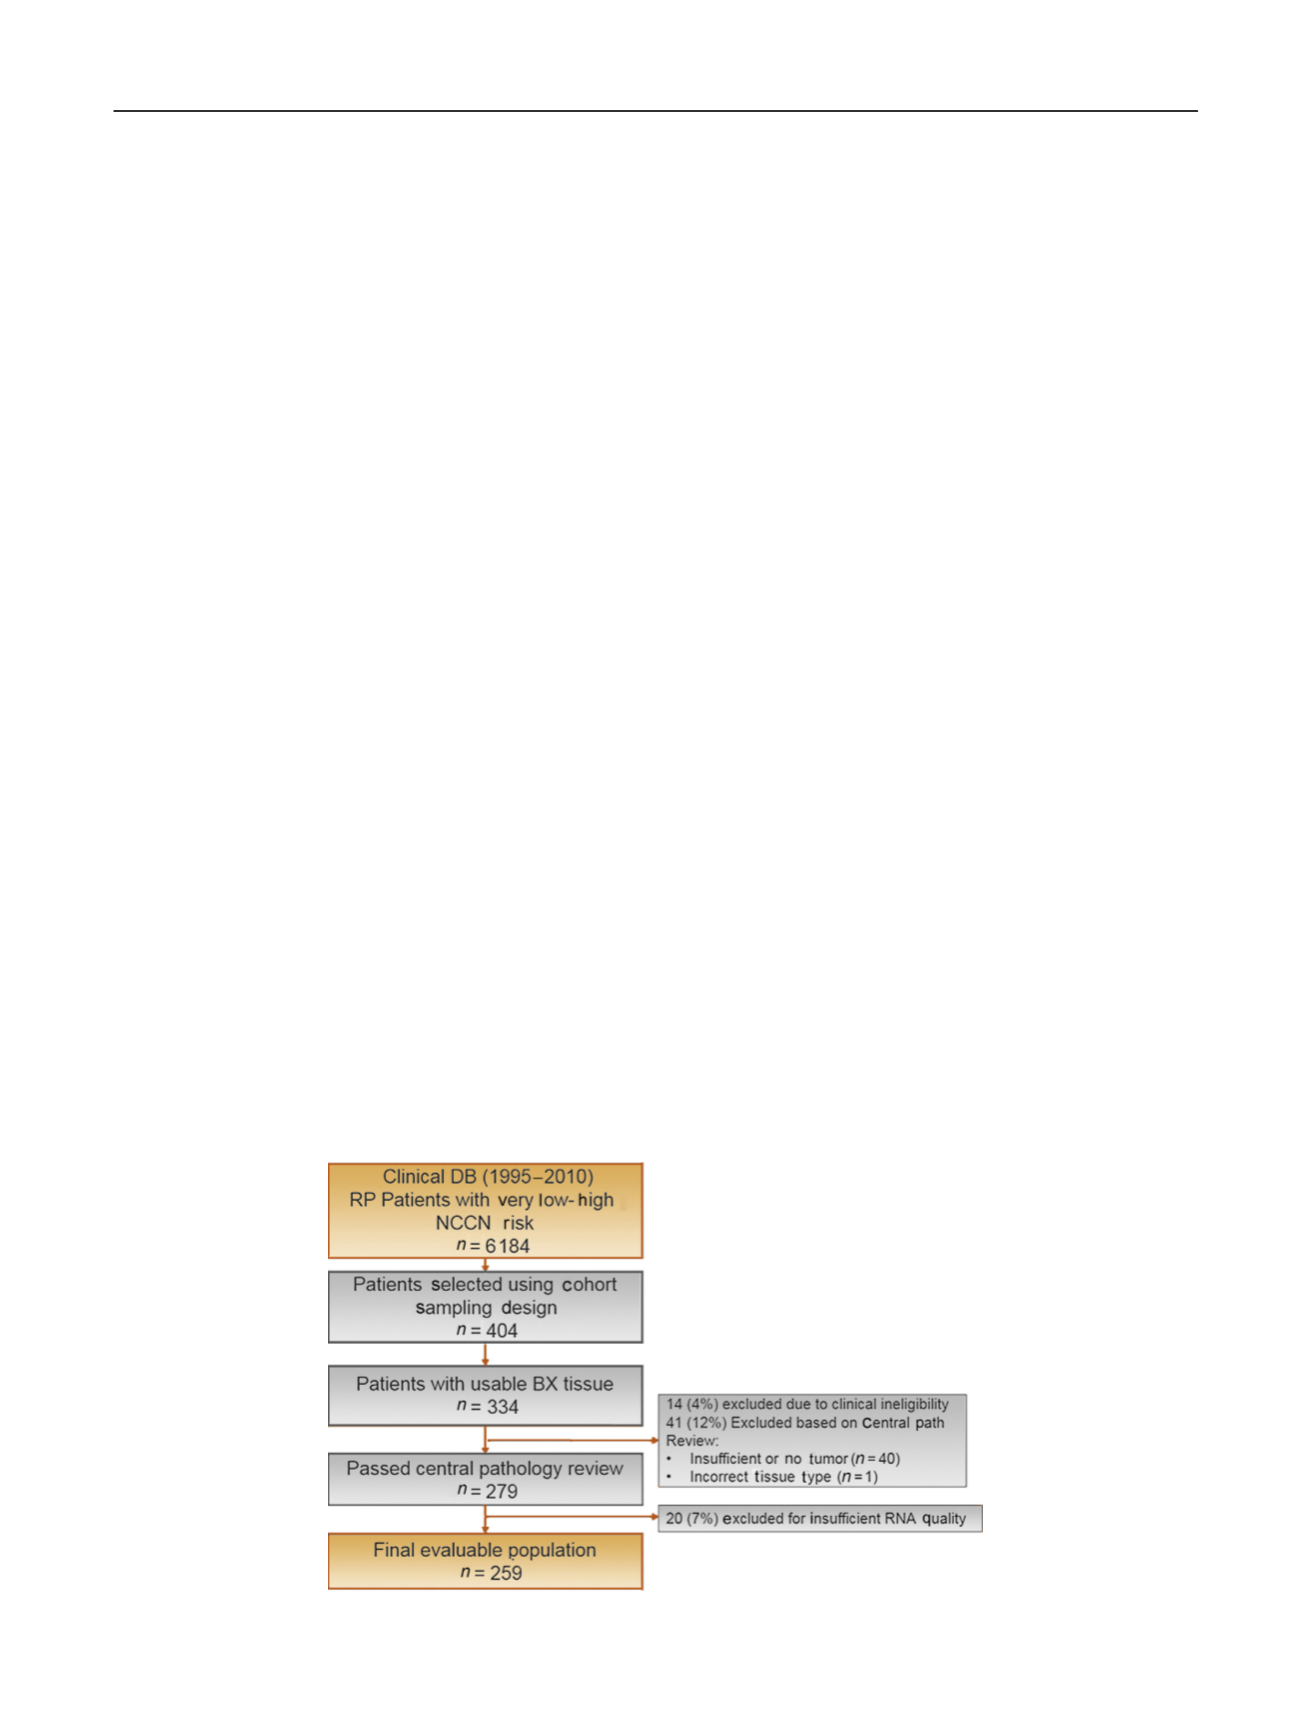
Among 6184 eligible patients, 404 were selected based on
the prespecified cohort sampling schema, 334 patients had
available archival prostate biopsy tissue, and 279 met all
clinical and pathological eligibility criteria. Fourteen cases
(4%) were excluded because of clinical ineligibility (five
patients died within
<
6 mo after surgery, two received
preoperative radiation before surgery, six did not had
prostate surgery, and one had spindle cell carcinoma) and
41 (12%) due to insufficient tumor or incorrect tumor type.
GPS results that passed quality assurance measures were
obtained for 259 men (93%), representing the final
evaluable population
( Fig. 1 ), which included 64 PCD,
79 metastatic events, and 117 BCR.
The median follow-up was 9.8 yr and interquartile range
5.8 yr; 79% of patients were Caucasian, 11% African
American, and 10% Asian or Hispanic. The distribution of
NCCN clinical risk groups was as follows: very low
—
3%;
low
—
21%; intermediate
—
67%; and high
—
9%. Baseline char-
acteristics in the evaluable population were similar to those
in the overall population of KPNC prostate cases with regard
to age, year of treatment, PSA levels, and clinical T stage
( Table 1 ;p
>
0.3). There was a greater preponderance of
Caucasians (79% vs 70%) and a decreased proportion of
other non
–
African American races (10% vs 19%;
p
= 0.01),
and a lower proportion of cases with an original biopsy GS
of 7 (29% vs 37%;
p
= 0.001) in the study cohort. As expected,
the percentage of patients with GS 7 was higher on the
central pathology review than on the original historical
pathology review, since many cases were diagnosed prior to
[(Fig._1)TD$FIG]
Fig. 1
–
REMARK diagram. DB = database; NCCN = National Comprehensive Cancer Network; RP = radical prostatectomy.
E U R O P E A N U R O L O GY 7 3 ( 2 0 18 ) 12 9
–
13 8
131