


 133 148

inflection point was around 11
–
12 yr after which the GPS
appeared to be less predictive of PCD. To account for this, a
model was fitted with censoring at 10 yr and the PH
assumption was valid for the censored model (
p
= 0.19 for
test for nonproportionality). GPS was more strongly
associated with time to PCD within 10 yr (HR per 20 GPS
units = 4.43; 95% CI: 2.66
–
7.34;
p
<
0.001).
3.4.
GPS as a predictor of BCR
The cohort included 117 patients with BCR (weighted
proportion = 23%) and 142 with non-BCR. GPS was strongly
associatedwith time to BCR (HR/20 units = 2.50; 95% CI 1.62
–
3.85;
p
<
0.0001) in univariable analysis, and was significant
after adjusting for diagnostic PSA, clinical T stage, and central
biopsy GS (HR/20 units = 1.96; 95% CI: 1.28
–
3.03;
p
= 0.002).
GPS remained significant after adjusting for clinical risk
groups with HR 2.11 (
p
<
0.001;
Table 2). The linearity and PH
assumptions were valid in the Cox PH model for BCR.
3.5.
Contribution of gene groups to the prediction of outcome
The 12 cancer-related genes in the GPS represent four
biological pathways: androgen signaling, stromal response,
cellular organization, and proliferation. Downregulation of
androgen signaling and upregulation of stromal response
gene groups were most strongly associated with time to
metastases, time to PCD, and time to BCR, but each of the
four gene groups contributed to the prediction of the end
points
( Fig. 3).
3.6.
Clinical utility of the GPS assay
Five- and 10-yr risk profile curves were generated to
describe risk prediction based on the continuous GPS for
metastasis, PCD, and BCR
( Fig. 3and Supplementary Fig. 1).
GPS provided additional individualized prognostic informa-
tion beyond NCCN risk stratification. It is noteworthy that no
distant metastases or PCD were observed in low- and
intermediate-risk patients with GPS values
<
20. Conversely,
intermediate-risk patients with GPS
>
40 had a 5-yr risk of
distant metastasis
–
free survival similar to clinically high-
risk patients (84% vs 85%; Supplementary Fig. 2).
In ROC analysis of metastases and PCD at 10 yr,
incorporation of GPS to CAPRA also improved the c-statistic
from 0.65 (CAPRA alone) to 0.73 (GPS + CAPRA) for
metastases, and from 0.78 (CAPRA alone) to 0.84 (GPS
+ CAPRA) for PCD, which was a relative increase in
c-statistic by 53% compared with CAPRA risk stratification
for 10-yr metastases, and by 21% for 10-yr PCD
( Fig. 4 Aand
4B). Similarly, incorporation of GPS improved the c-statistic
from 0.66 for NCCN alone to 0.75 (GPS + NCCN) for
metastases (
p
<
0.001), and from 0.71 (NCCN alone) to
0.81 (GPS + NCCN) for PCD (
p
<
0.001). Thus, when GPS was
combined with NCCN, the c-statistic increased by 56%
compared with NCCN risk stratification for 10-yr metasta-
ses, and by 48% for 10-yr PCD (data not shown).
GPS was predictive of time to metastases, time to PCD,
and time to BCR within clinically relevant subsets of
patients by NCCN risk groups, age, race, and central biopsy
GS (Supplementary Tables 1
–
3, and Supplementary Fig. 3).
GPS was also a significant predictor of all three end points in
the subset of patients who underwent 12 core biopsies
(52% weighted proportion of full study cohort), after
adjusting for PSA density (
p
0.004 for all; data not shown).
4.
Discussion
The adoption of new prognostic biomarkers for PCa requires
a high level of evidence, including analytic and clinical
validation and prospective support of clinical utility
[19]. The GPS has previously been validated as a predictor
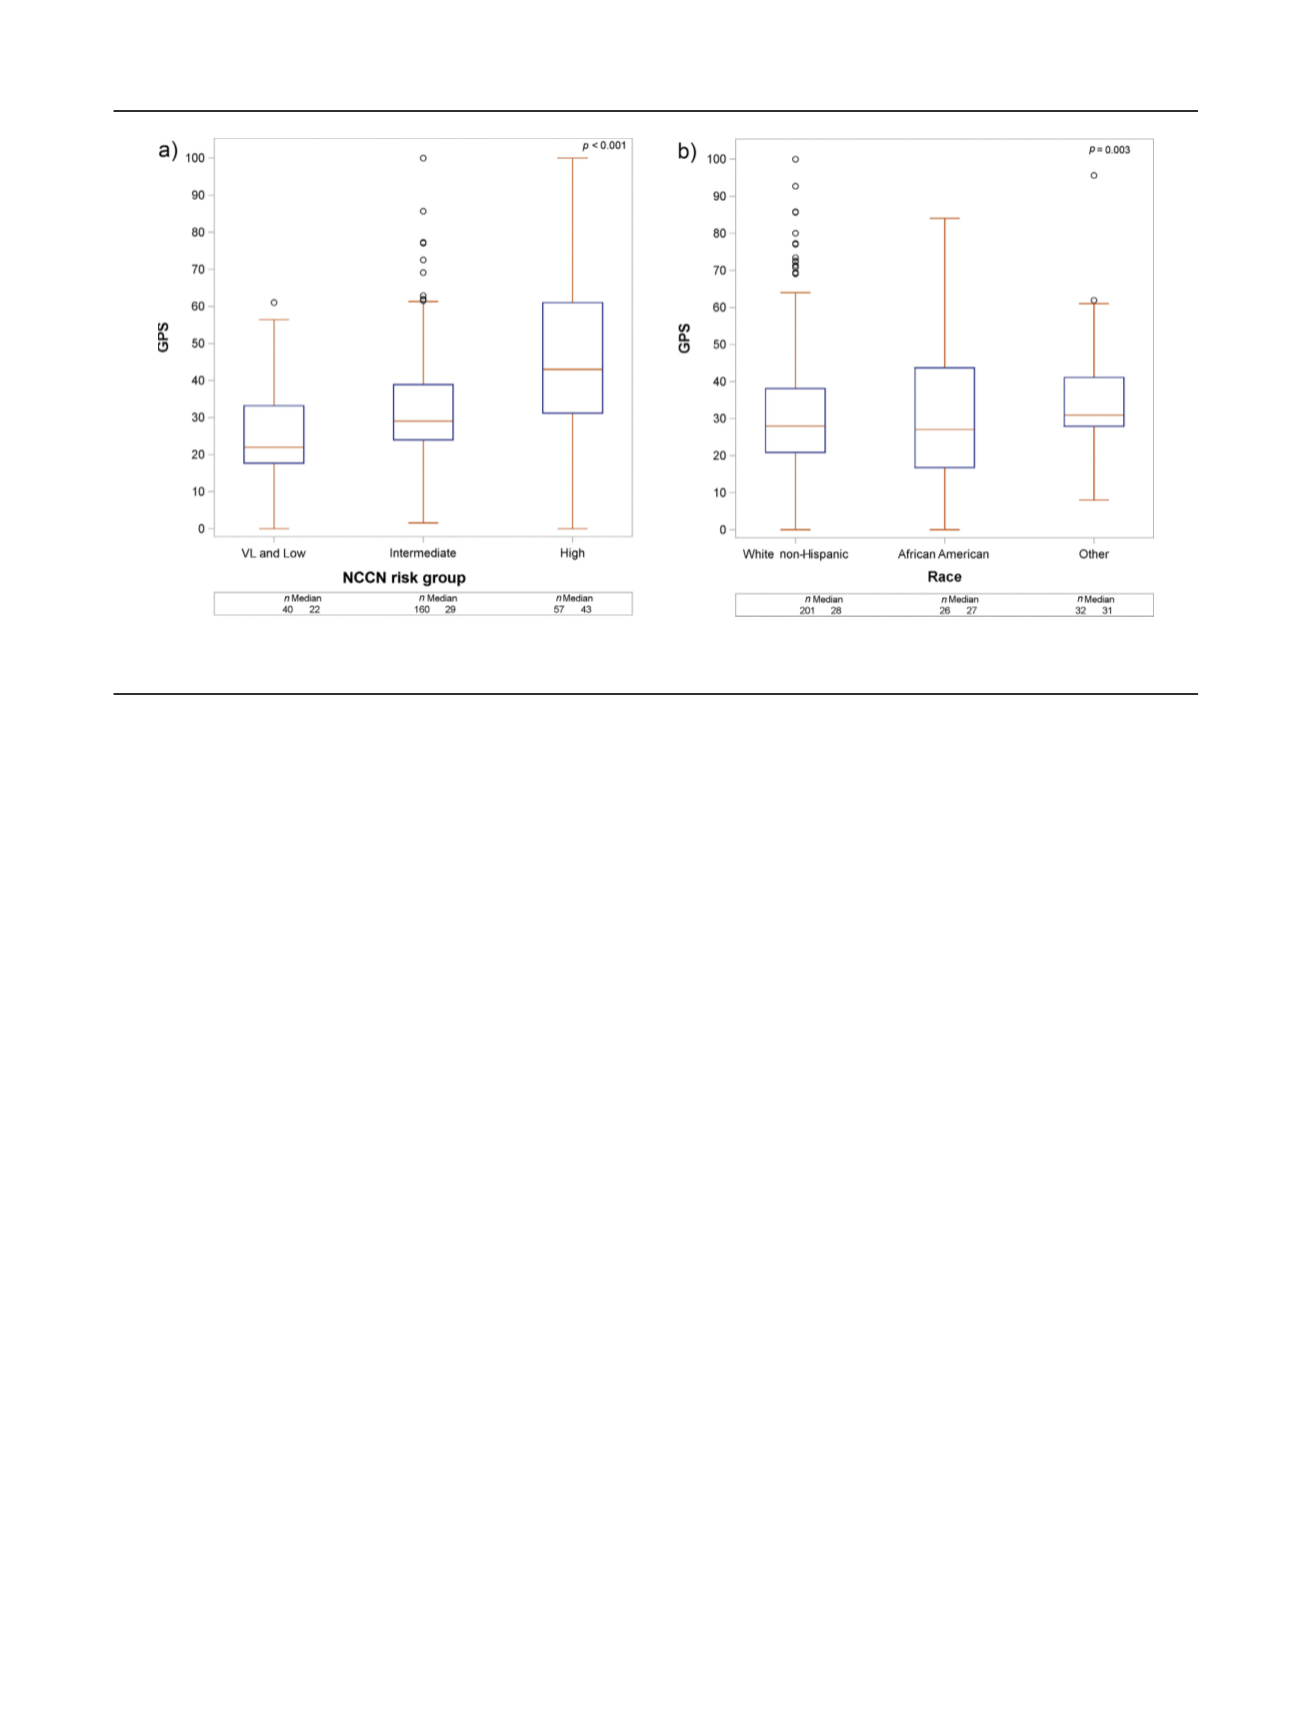
[(Fig._2)TD$FIG]
Fig. 2
–
GPS distribution by (A) NCCN risk group and (B) race. GPS = Genomic Prostate Score; NCCN = National Comprehensive Cancer Network; VL = very
low.
E U R O P E A N U R O L O GY 7 3 ( 2 0 18 ) 12 9
–
13 8
133