


 44 148

age
( Table 5)
[9,16,36,38,40,42–46]. For patients aged
>
80
yr a 4.61–6.25-fold increased risk of POM is reported. From
the age of 70 yr the 30-d and 90-d mortality rate is
significantly increased with reported odds ratios up to
1.6 and 5.8, respectively. For patients aged
>
80 yr the odds
ratios for 90-d mortality rises further to 2.4–7.9.
In contrast, the incidence of late complications appear to
be equal or even more prevalent in younger compared with
older patients
[7,12,27,35] .4.
Discussion
From nationwide registries, it becomes clear that the
treatment approach of young and elderly patients with
nonmetastatic MIBC differs
[47,48] .Evaluation of a popula-
tion-based cancer registry in the UK for example indicates
that the percentage of patients that receive a curative
treatment drops from 52% to 12% for patients aged
<
60 yr
versus
>
80 yr
[49] .Fear of severe therapy-inducedmorbidity
and an estimated short life expectancy, as a result of poor
health status, are suggested to be themain reasons why a less
aggressive therapeutic approach is applied in elderly people.
Whether it is justified to undertreat elderly patients is
doubtful in view of available literature. This systematic
review gives an overview of the reported outcome in elderly
patients treated with curative therapies for nonmetastatic
MIBC. These results are compared with the outcome
observed in a younger population with MIBC.
An age cut-off of 65 yr is often applied to discriminate
young from old patients. However, the stratification of old
versus young patients differs in the articles that were
selected for this systematic review. Most of the included
studies, reporting on outcome after RC, define elderly
patients as patients aged
>
70 yr. In view of an aging
population and taking into account that the median age at
diagnosis of MIBC is 70 yr, age stratification with a cut-off of
70 yr for defining
elderly patients
is defendable. In contrast,
included papers evaluating the outcome after radiotherapy
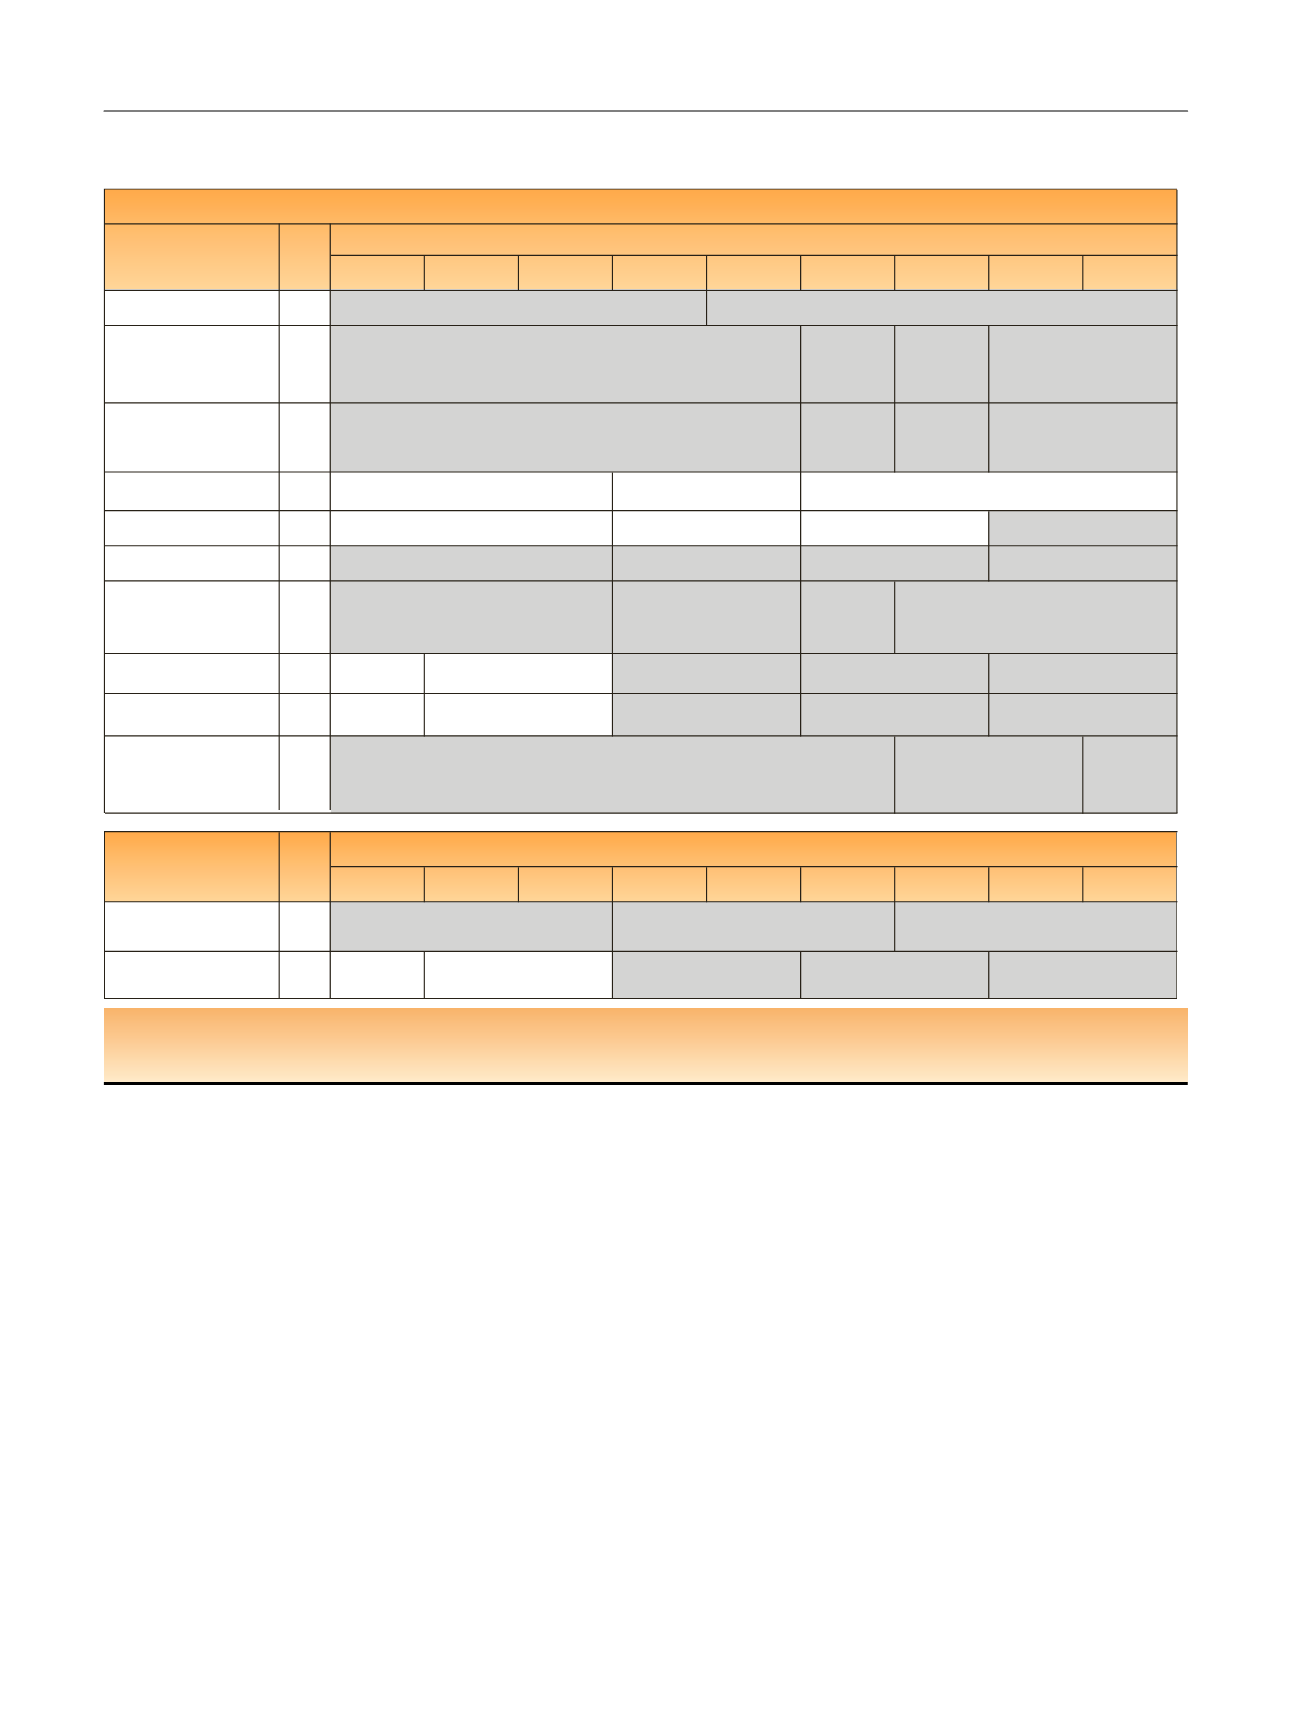
Table 2 – Multivariate analysis evaluating impact of age on overall survival rates per age group and per study. The studies in grey represent
the studies where a significant difference was observed between younger and older patients
50
–
54
<50
55
–
59
60
–
64
65
–
69
70
–
74
75
–
79
80
–
84
≥85
Hafron et al [5] 2005
288
Nisjiyama et al [14] 2004 1113
1.34 (95%CI:
1.03
-
1.74,
p
= 0.027)
(
N
= 268)
1.44 (95%CI:
1.01
-
2.06,
p
= 0.044)
(
N
= 110)
Leveridge et al [15] 2015
1701
ref (
N
= 582)
1.16 (95%CI:
1.02
-
1.33)
(
N
= 541)
Dalbagni et al [19] 2001
297
Fairey et al [16] 2012
2263
Patel et al [17] 2015
804
Zakaria et al [20] 2016
2671
1.79(95%CI:
1.54
-
2.07,
p
< 0.0001)
(
N
= 540)
Chromecki et al [21] 2012
ref (
N
= 321)
4429
Gore et al [22] 2005 a
ref (
N
= 186)
3976
Morgan et al [41] 2011 a
3170
1.8(95%CI:
1.34
-
2.4,
p
< 0.001)
(
N
=151)
50
-
54
<50
55
-
59
60
-
64
65
-
69
70
-
74
75
-
79
80
-
84
>/=85
Goossens-Laan b et al [24]
2014
2445
Hayter et al [25] 1999
1372
0.71 (95% CI:
0.47-1.09)
(N=51)
0.82 (95%CI:0.64
-
1.06)
(
N
= 150)
ref (
N
= 549)
1.31 (95%CI:1.11
-
1.53)
(
N
= 549)
1.49 (95%CI:1.22
-
1.81)
(
N
= 218)
N
Author
Trials with radiotherapy
ref (
N
= 444)
1.3 (95%CI:1.1
-
1.5) (
N
= 1062)
2.0 (95%CI:1.7
-
2.4) (
N
= 939)
ref(N=582)
1.41(95%CI:1.23
-
1.62,
p
< 0.001) (
N
= 1406)
0.955 (95%CI:0.795
-
1.202,
p
= 0.697) (
N
= 815)
1.400(95%CI:1.134
-
1.728,
p
= 0.002) (
N
= 1595)
1.864(95%CI:1.509
-
2.304,
p
< 0.001) (
N
= 1423)
3.077(95%CI:2.381
-
3.977,
p
< 0.001)(
N
= 275)
1.11(95%CI:0.9
-
1.28,
p
= 0.315) (
N
= 633)
1.47(95%CI:1.22
-
1.78,
p
< 0.001) (
N
= 1418)
1.98(95%CI:1.63
-
2.39,
p
< 0.001) (
N
= 1458)
3.22(95%CI:2.6
-
3.98,
p
< 0.001)
(
N
= 281)
ref (
N
= 557)
1.11(95%CI:0.87
-
1.4) (
N
= 679)
1.15 (0.92
-
1.44)(
N
= 846)
2.03(1.51
-
2.75) (
N
= 181)
ref (
N
= 150)
1.64 (95%CI:1.20
-
2.26)
(
N
= 245)
1.7 (95%CI:1.26
-
2.29) (
N
= 339) 2.78 (95%CI:1.87
-
4.13) (
N
= 70)
ref (
N
= 625)
1.66(95%CI:1.44
-
1.90,
p
< 0.0001) (N = 795)
2.30 (95%CI:1.94
-
2.73,
p
< 0.0001) (
N
= 711)
Overall survival
N
Author
Trials with radical cystectomy
ref (
N
= 132)
2.09 (95%CI:1.54
-
2.83,
p
< 0.001) (
N
= 156)
ref (
N
= 691)
1.63 (95%CI:1.06
-
2.53,
p
= 0.027) (
N
= 62)
NR
1.23 (95%CI:1.08
-
1.41,
p
= 0.007) (
N
= 578)
ref (
N
= 73)
1.210 (95%CI:0.687
-
2.133,
p
= 0.5093) (
N
= 106)
1.376(95%CI:0.815
-
2.324,
p
= 0.2323) (
N
= 118)
a
Studies based on Surveillance, Epidemiology, and End Results registries.
b
Trial on radical cystectomy and external beam radiotherapy.
CI = confidence interval; OR = odds ratio; Ref = reference.
E U R O P E A N U R O L O G Y 7 3 ( 2 0 1 8 ) 4 0 – 5 0
44