


 45 148

regimens, most often defined elderly patients as patients aged
75 yr instead of 70 yr, reflecting the inclusion of an even
older population in these trials.
Our systematic review suggests that OS decreases in
elderly patients and worsens for patients aged
>
80 yr, as
expected. A shorter life expectancy due to an impaired
health status accounts for this finding. The level of frailty,
determined by dependency, comorbidities and nutrition
status, as well as impaired renal function, which is on its
own associated with reduced survival
[50] ,defines the
health status of elderly MIBC patients. Unfortunately, only a
few articles included in this systematic review gave detailed
information on either comorbidities or renal function
(Supplementary Table 2).
For elderly patients and in particular, patients aged
>
80
yr, life expectancy has to be weighted against the potential
harms and benefits from a curative treatment for each
patient individually. Existing life tables can be used to help
us to define the expected years of life at separate ages
[51]. Equally important is estimating the risk of dying of
MIBC. After a curative treatment, the prognosis of patients
with MIBC is reserved. But, when left untreated, the median
OS of patients with T3 MIBC is
<
1 yr
[52]. Even when
stratifying for Charlson comorbidity index group, curative
treatments, either RC or chemoradiation therapy, provide a
clear survival benefit compared with nonstandard treat-
ments
[53]. The balance of dying from MIBC versus other
causes of death most often thus advocates treatment, even
in the elderly patients. A systematic use of some form of
geriatric assessments may allow physicians to select
appropriate candidates for curative treatments.
Ideally, all older cancer patients should be evaluated by a
GA followed by interventions and follow-up
[3] .This GA has
proven to be independently associated with changes in
cancer treatment
[54]. Nowadays, there is no standard GA
model. Thus, the prevalence of being frail and/or at risk may
vary largely within a well-defined cohort depending on the
questionnaires and definitions used. Moreover, this ap-
proach is resource consuming and not necessary in all
patients. Therefore, the use of a screening tool has been
proposed to identify patients in need of GA and multidisci-
plinary approach. If abnormal, screening should be followed
by GA and guided multidisciplinary interventions. At this
time, no specific screening tool can be recommended or
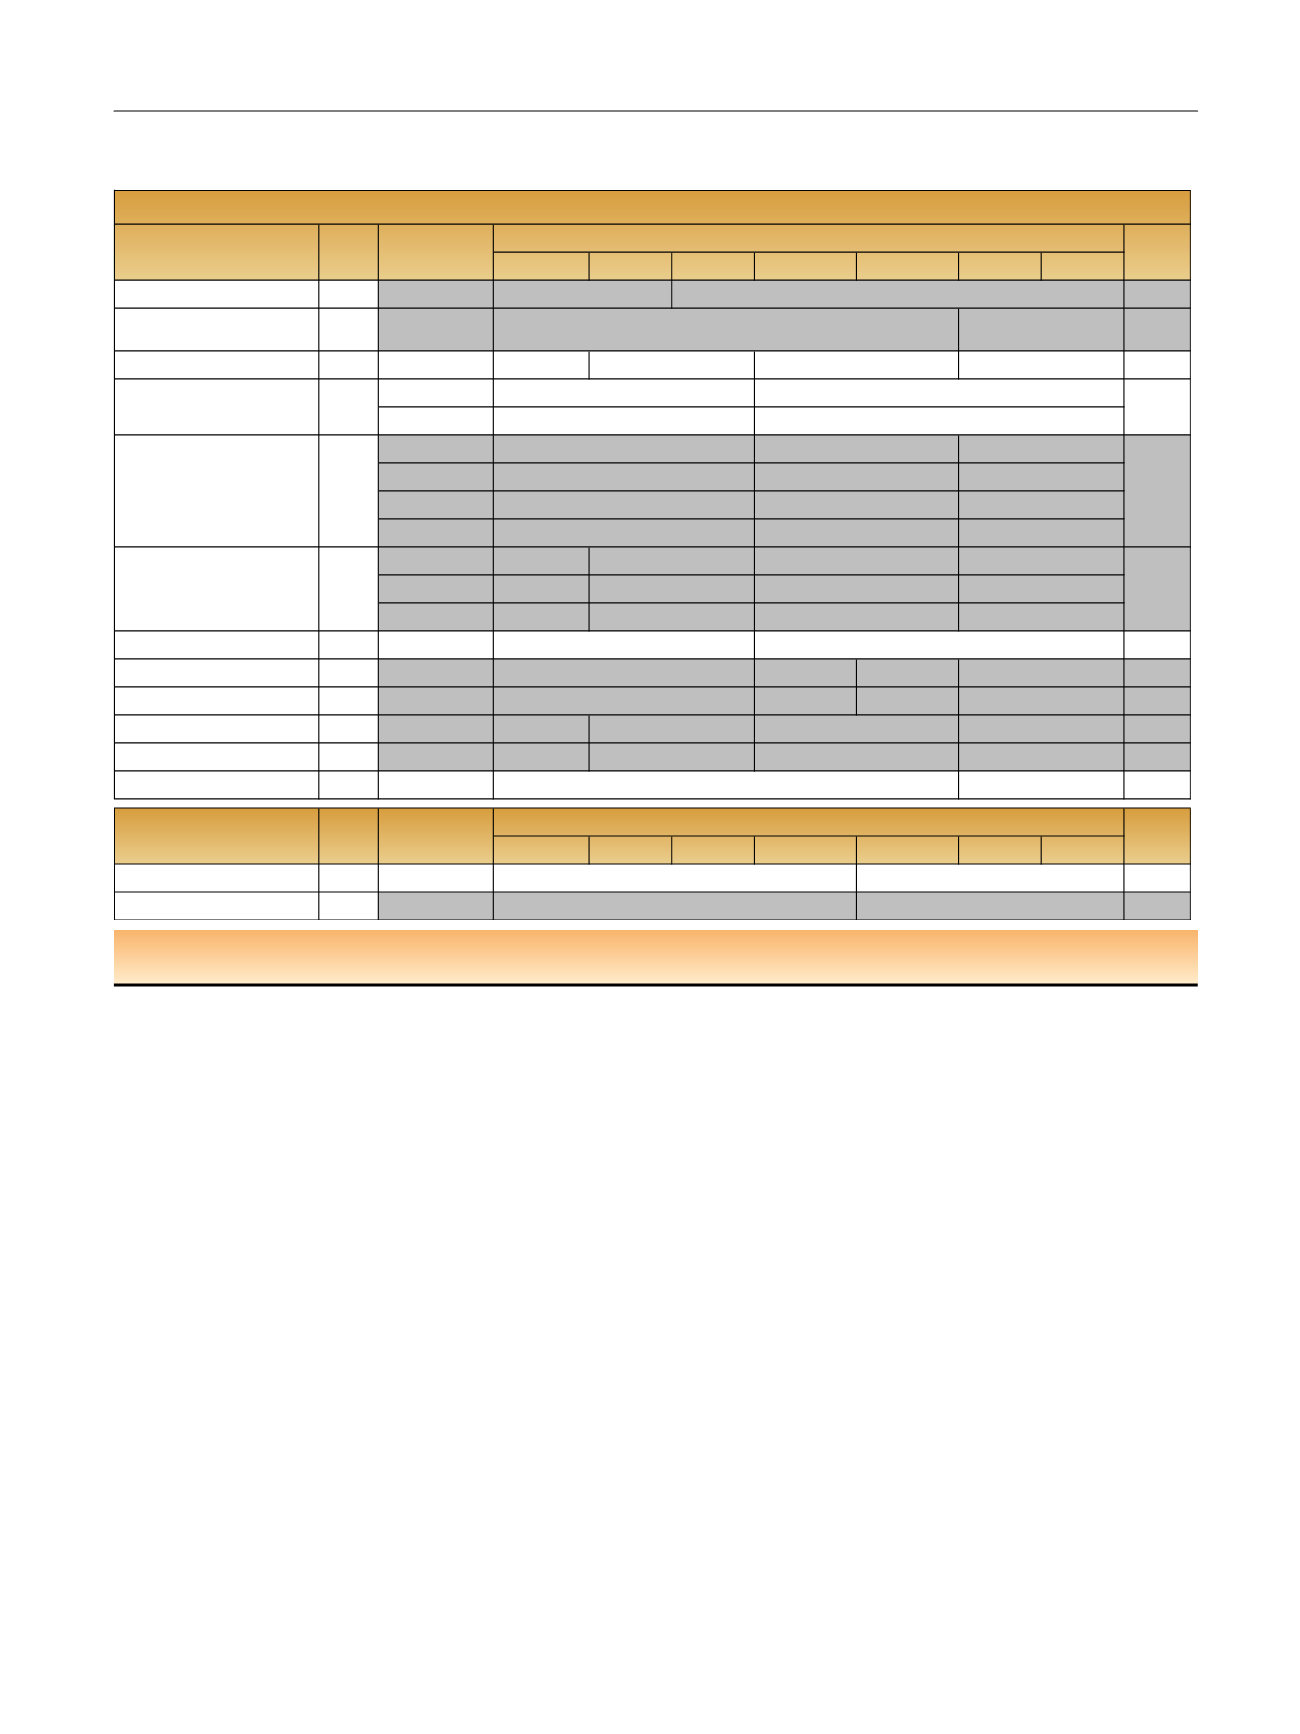
Table 3 – Reported estimates of cancer specific survival rates per age group and per study. The studies in grey represent the studies where a
significant difference was observed between younger and older patients
60
-
64
<60
65
–
69
70
–
74
75
–
79
80
–
84
≥85
Trasher et al [26] 1994
NR
531
<0.001
Yamanaka et al [27] 2007
2
-
year
629
0.001
Horovitz et al [6] 2012
3
-
year
605
70% (
N
= 165)
0.4
2
-
year
5
-
year
1
-
year
2
-
year
5
-
year
10
-
year
3
-
year
79% (
N
= 240)
7
-
year
70%
10
-
year
64%
Guillotreau et al [11] 2012
5
-
year
146
0.7
Madersbacher et al [29] 2010
5
-
year
845
61% (
N
= 517) 60% (
N
= 269)
0.01
Leveridge et al [15] 2015
5
-
year
3320
37% (
N
= 674) 34% (
N
= 627)
<0.001
Fairey et al [16] 2012
5
-
year
2263
66% (
N
= 557)
0.0014
Patel et al [17] 2015
5
-
year
804
70% (
N
= 150)
<0.001
Donat et al [30] 2010
5
-
year
1142
NS
60
-
64
<60
65
-
69
70
-
74
75
-
79
80
-
84
>/=85
Mak et al [32] 2014
5
-
year
467
0.84
Fossa et al [33] 1993
5
-
year
308
0.01
Rink et al [8] 2011
390
Liberman et al [9] 2011 a
12722
Nielsen et al [28] 2007
888
N
Author
0.0331
51%
78% (
N
= 265)
76% (N=125)
0.22
57%
68%
89% (
N
= 6803)
84% (
N
= 4480)
75% (
N
= 1439)
<0.001
60%
72%
78%
50%
42% (
N
= 1362)
32% (
N
= 657)
49%
53%
54%
43%
55%
60%
46% (
N
= 59)
NR
68% (
N
= 272)
50% (
N
= 259)
N
Author
p
-
value
25% (
N
= 1025)
26% (
N
= 117)
Reported
measure unit
Trials with Radiotherapy
69% (
N
= 846)
52% (
N
= 181)
65% (
N
= 245)
58% (
N
= 339)
42% (
N
= 70)
60%
65%
70%(
N
=557)
46% (
N
= 72)
70% (
N
= 192)
65% (
N
= 201)
60% (
N
= 47)
Cancer specific survival
26% (
N
= 217)
19% (
N
= 91)
Trials with Radical cystectomy
p
-
value
70% (
N
= 387)
71% (
N
= 80)
72% (
N
= 331)
70% (
N
= 266)
65% (
N
= 51)
58%
55%
63%
59%
69% (
N
= 679)
Reported
measure unit
a
Studies based on Surveillance, Epidemiology, and End Results registries.
NR = not reported; NS = not significant.
E U R O P E A N U R O L O G Y 7 3 ( 2 0 1 8 ) 4 0 – 5 0
45